Titan Support
Available Training
-
The Variety of Decibel
-
Creating an ABRIS Test Protocol
-
Creating a TEOAE Pass/Refer Test Protocol
-
Creating a DPOAE Pass/Refer Test Protocol
-
TEOAE Probe Test
-
How to Identify a Blocked Probe Fit
-
How to Identify a Loose Probe Fit
-
How to Identify Fluid in the Middle Ear
-
How to Identify Negative Middle Ear Pressure
-
How to Identify Otosclerosis
-
How to Identify a Perforated Eardrum
-
How to Clean the Probe Tip
-
Acoustic Reflex Testing
-
Daily System Check
-
Wideband Tympanometry Research License
-
OAE Testing with PE Tubes
-
How to Change the Probe Tip
-
How to Measure eSRT
-
How to perform TEOAE on the Titan using a PC
-
Nape Electrode Montage
-
Pressurized DPOAE
-
Pressurized TEOAE
-
Selecting the Correct Ear Tip
-
Electrode Tips & Tricks
-
How to perform ABRIS on the Titan without using a PC
-
Best Practices for OAE Testing
-
Mastoid Electrode Montage
-
How to perform TEOAE on the Titan without using a PC
-
How to perform DPOAE on the Titan using a PC
-
How to perform DPOAE on the Titan without using a PC
-
Using the Titan ABRIS module
-
How to clean the Titan probe tube
-
How to print without a database
How to Identify an Ossicular Discontinuity
About the author
The information presented here is based on clinical examples as well as modeled patterns. Text and accompanying. Absorbance sketch is authored by Navid Shahnaz, PhD, Aud, Associate Professor of Audiology in the School of Audiology & Speech Sciences at the University of British Columbia (UBC).
Caveats
Unless the Absorbance is evaluated at tympanometric peak pressure, any positive or negative middle ear pressure will influence the absorbance characteristics and obscure a direct interpretation.
It should be noted, that recordings on ears with negative middle ear pressure will vary between patients – the shown Absorbance pattern is a sketched example only.
Absorbance characteristics to look for
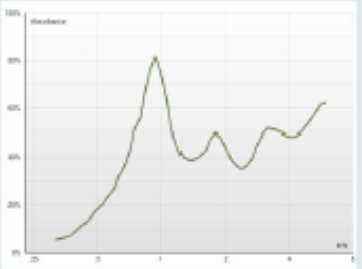
The Absorbance exhibits a very pronounced peak somewhere in the range slightly below 1 kHz. Absorbance in general increases in the frequency range below 900 Hz and decreases in the frequency range between 2.5 kHz and 3.5 kHz.

Sketched example
Consequences of probe fit
All Absorbance measures need to have a good probe fit to be reliable. Evaluating Absorbance as provided by the 3D Tympanometry test ensures that a reasonably air tight probe seal was accomplished, as the air pressure sweep would not have been performed otherwise. In addition to an air tight probe seal, a deeper rather than a shallower probe insertion ensures the most accurate Absorbance measures. Shallow insertions tend to provide more elevated Absorbance readings at lower frequencies. This is somewhat similar to normal Tympanometry measures that are also influenced by probe fit and probe insertion depth.
Suggested reading
Effects of Middle-Ear Disorders on Power Reflectance Measured in Cadaveric Ear Canals, Voss, Susan E., Merchant, Gabrielle R.,Horton, Nicholas J., Ear & Hearing. 33(2):195-208, March/April 2012.
Acoustic Immittance Measures, Basic and Advanced Practice, 2013, Lisa Hunter, Phd, FAAA, Navid Shahnaz, PhD, Aud. (C), Plural Publishing. ISBN10: 1-59756-437-0, ISBN13: 978-1-59756-437-3.
