
How to Perform the MatchingVR Module
This quick guide provides information on how to perform the MatchingVR module on the Virtualis PhysioVR, StaticVR, and MotionVR solutions. For additional information, please reference the MatchingVR user manual.
Equipment needed
To view the equipment needed, click on the “i” icon in the upper right corner of the module.
To perform this module on the PhysioVR solution, you will need the VR headset and 1 controller or tracker.
To perform this module on the StaticVR or MotionVR solutions, you will need the static or dynamic force plates. The VR headset is optional for this module, however if you do not use the VR headset, you will need a secondary screen to perform in “Screen mode”, which allows the patient to see the virtual environment on a screen.
Patient setup
The patient can sit or stand when using this module in Controller mode, however the patient must stand when using the Forceplates mode.
1. Open a patient profile.
2. Click on “Start a session” to access the module list.
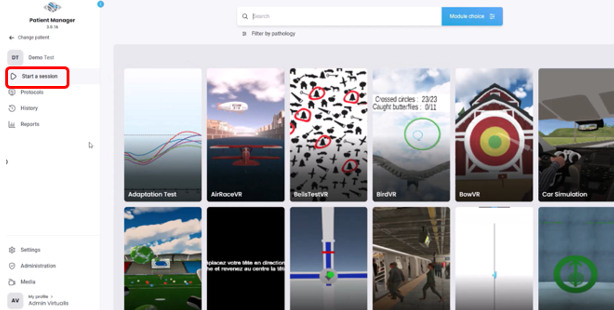
3. Type “MatchingVR” in the search bar. The first three letters are often enough.
4. Click on the MatchingVR button to launch the module.
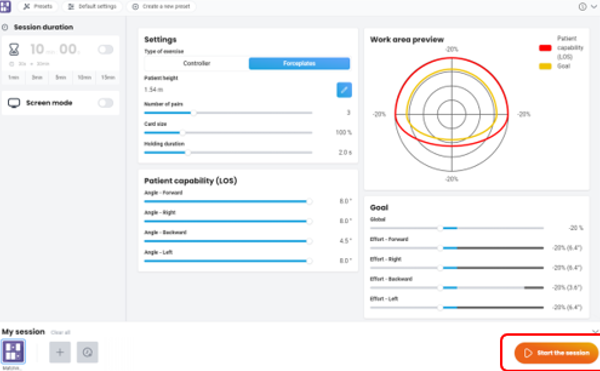
5. Select the initial settings based on your patient’s therapeutic goals.
Controller mode:
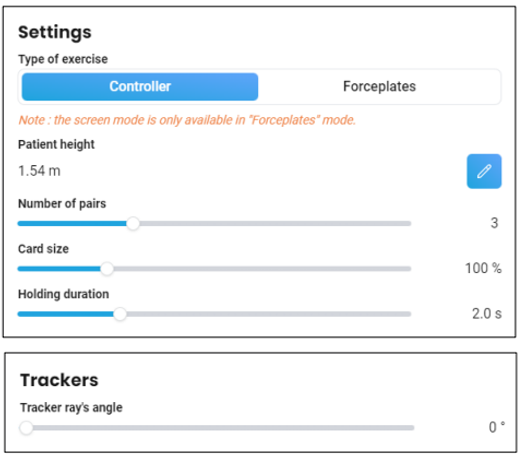
- Patient height: this should be automatically populated from the patient profile.
- Number of pairs: how many pairs of cards will appear.
- Value: 1 to 8.
- Card size.
- Value: 50 to 280%.
- Holding duration: how long the patient must touch card before it flips over.
- Value: 1 to 5 seconds.
- Tracker ray’s angle: if using a tracker, you can modify based on the patient’s function.
- Value: 0 to 90⁰.
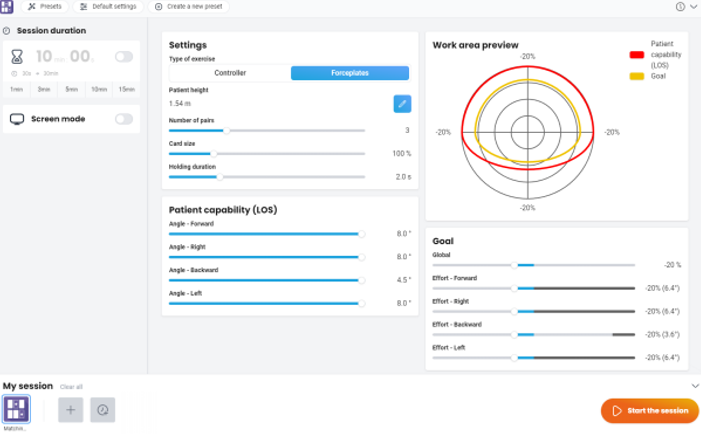
Forceplates mode:
- If you have performed the LOS assessment, your patient’s results will automatically appear in patient capability and the work area preview sections.
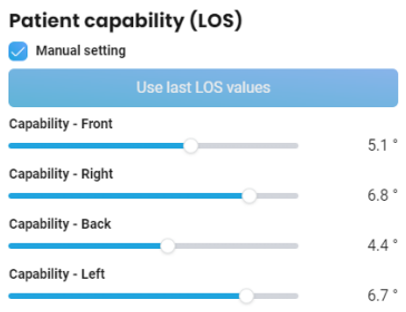
- Patient capability:
- Manual setting: when selected you can edit the patient’s LOS.
- Value in all directions: 0⁰ to 8⁰.
- Manual setting: when selected you can edit the patient’s LOS.
- Goal: how far the targets will be placed.
- Direction: global, forward, right, backward, left.
- Negative values: smaller movement compared to LOS assessment value.
- Positive values: larger movement compared to LOS assessment value.
- Direction: global, forward, right, backward, left.
6. Once settings have been finalized, click on “Start the session”.
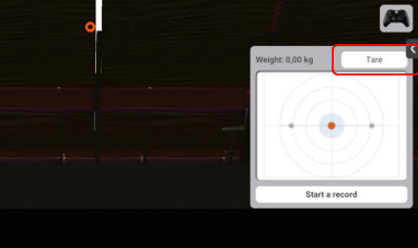
7. Before the patient steps on the force plate, click “Tare.” This will set the weight on the force plates to zero.
8. Instruct the patient that the goal is to flip the cards over and find all the matching pairs. This is completed by:
- Controller mode: point one controller at a card. The card flips over after the set holding duration or the patient can click the back trigger on the controller to flip the card over.
- Forceplates mode: the patient will shift their weight towards a card. The card flips over after the set holding duration.
9. Assist the patient on the force plates.
10. If using the VR headset, fit them on patient’s head. Have patient look forward and press “C” on the keyboard to center the image in the VR headset.
11. Press “Start” to begin the module.
12. Perform real time progressions by changing the parameters on the left side of the clinician screen (see below). Patients cannot see these adjustments.
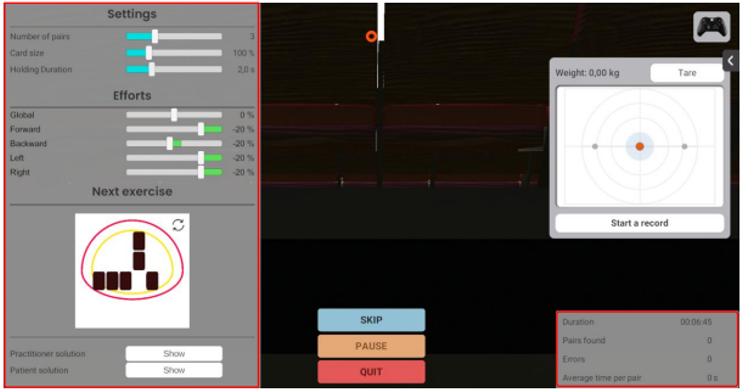
In general, increasing the number of pairs, effort percentage, and hold duration, or decreasing the card size increases the complexity of the task.
13. You can view real time feedback to guide your progressions in the lower right corner of the clinician screen (see picture above).
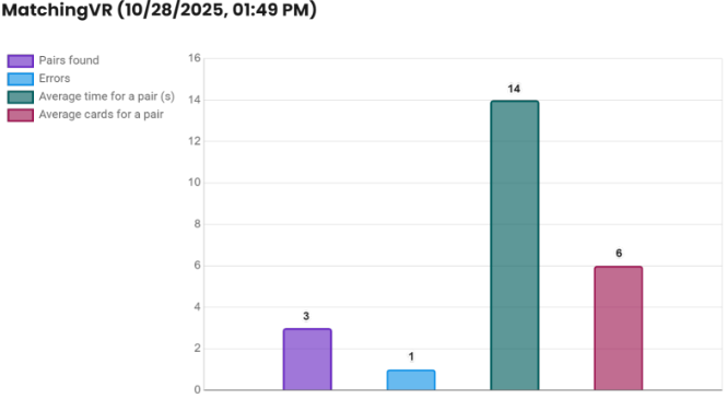
14. When the module is complete, you can view the results by clicking on the histogram icon.
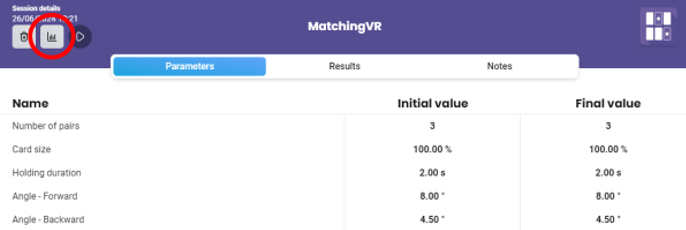
Default data points: pairs found, errors, average time for a pair (seconds), average cards for a pair.
Bar graph example:
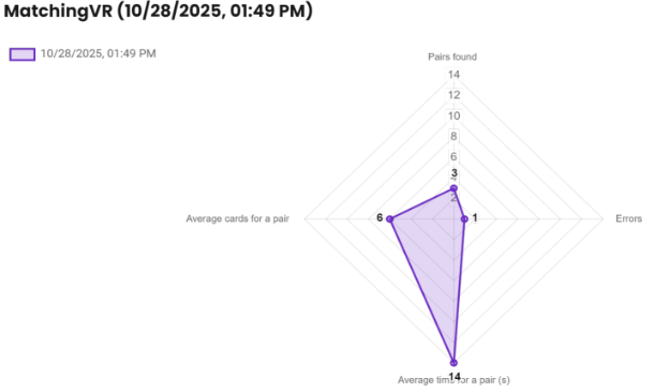
Radar plot example:
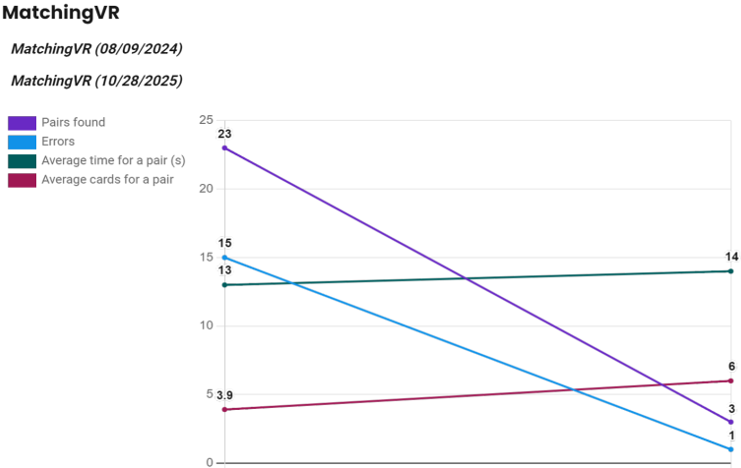
Line graph example (compares multiple sessions):
You can select additional data points by clicking “chart options” in the upper left corner of the screen.
Presenter
