
How to Perform the Optokinetic Module
This quick guide provides information on how to perform the Optokinetic module on the Virtualis BalanceVR and PhysioVR solutions. For additional information, please reference the Optokinetic user manual.
Equipment needed
To view the equipment needed, click on the “i” icon in the upper right corner of the module. To perform the Optokinetic module, you will need the VR headset. Note: this module is also compatible with the StaticVR and MotionVR force plates.
Patient setup
Depending on the patient’s therapeutic goals, they can sit or stand to perform this module.
1. Open a patient profile.
2. Click on “Start a session” to access the module list.
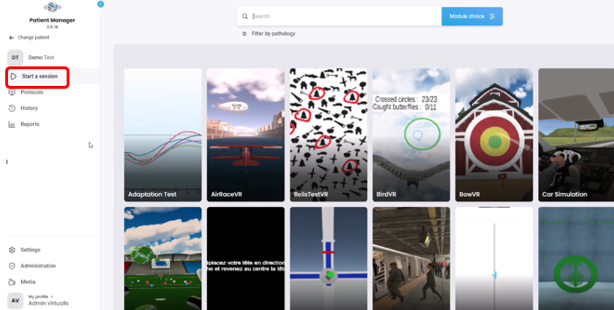
3. Type “Optokinetic” in the search bar. The first three letters are often enough.
4. Click on the Optokinetic button to launch the module.
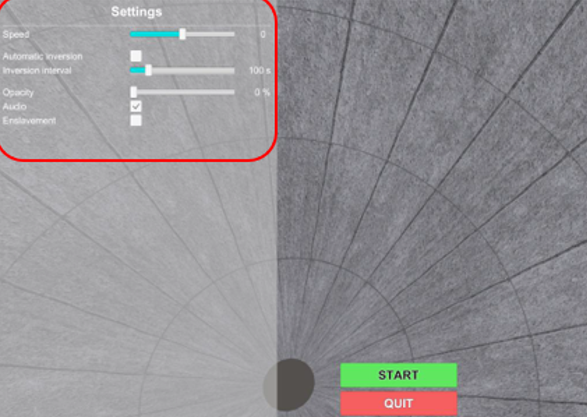
5. Select the initial settings based on your patient’s therapeutic goals.
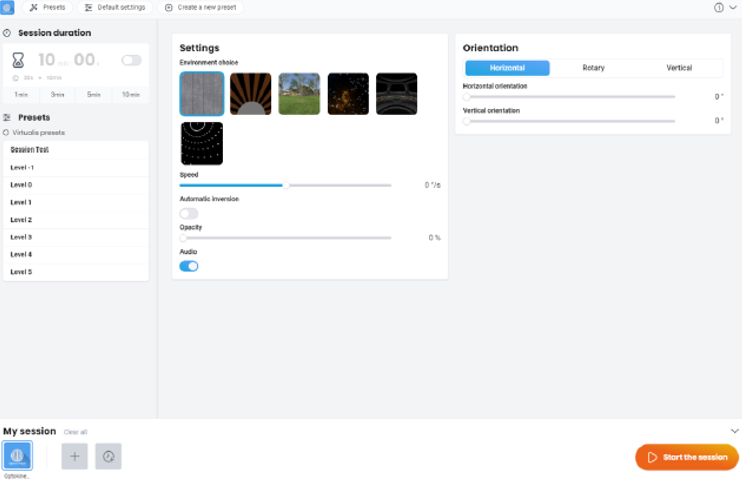
- Presets: level -1 to 5 with increasing level of complexity.
- Environment choice:
- Optotree: mild disturbance.
- 3D sphere: moderate disturbance.
- Optostation: moderate disturbance.
- Planetarium: moderate disturbance.
- OptoSpace: strong disturbance.
- Barany drum: strong disturbance.
- Speed:
- Negative numbers are a counterclockwise direction.
- Positive numbers are a clockwise direction.
- Automatic inversion: reverses direction at a set time.
- Opacity: transparency of the environment.
- Orientation:
- Horizontal: low disturbance.
- Vertical: moderate to high disturbance.
- Rotary: strong to extreme disturbance.
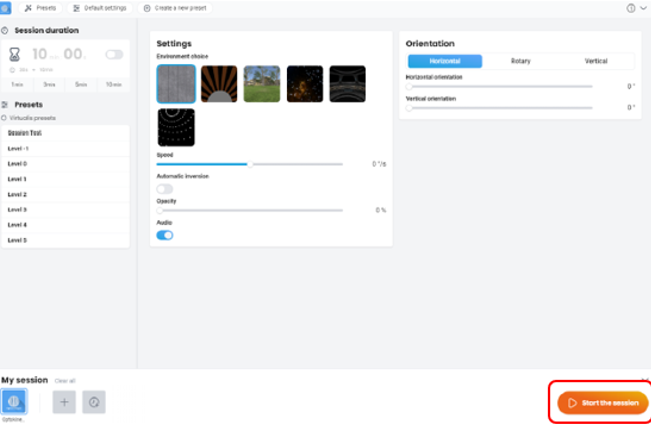
6. Once settings have been finalized, click on “Start the session”.
7. Before starting the module, have the patient look forward and press “C” on the keyboard to center the image inside the VR headset.
8. The goal of the module is to decrease a patient’s symptoms through progressive habituation. You should monitor your patient’s symptoms closely throughout the activity.
9. Press “Start” to begin the module.
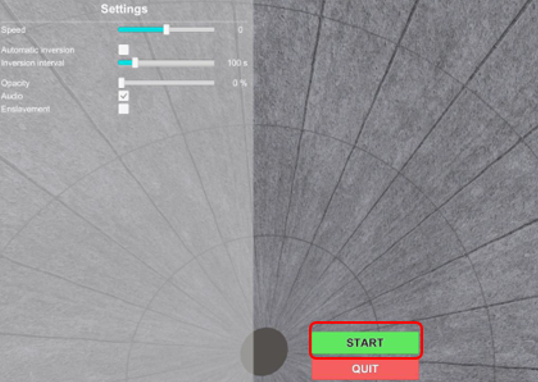
10. Perform real time progressions by changing the parameters on the left side of the clinician screen (see below). Note: the number of parameters is based on the environment selected. Patients cannot see these adjustments.
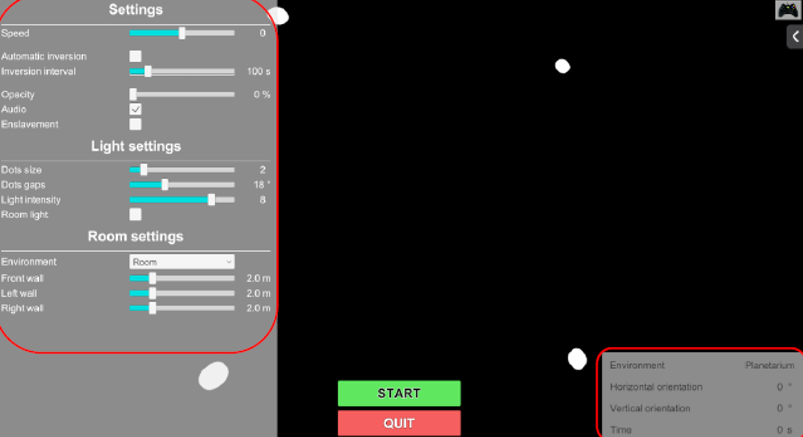
In general, decreasing the opacity or increasing the speed, changing the level of the environmental complexity (Optotree → 3D Sphere/Optostation/Planetarium → OptoSpace/Barany drum), and direction of movement (horizontal → vertical → rotary) increases the complexity of the activity.
11. Click the Xbox remote icon in the upper right corner to view information about shortcut keys.
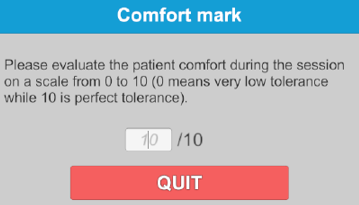
12. When the module is complete, a window appears to enter the patient’s “Comfort mark.” This is how you can track the patient’s tolerance to the module.
13. Then you can view the results by clicking on the histogram icon.
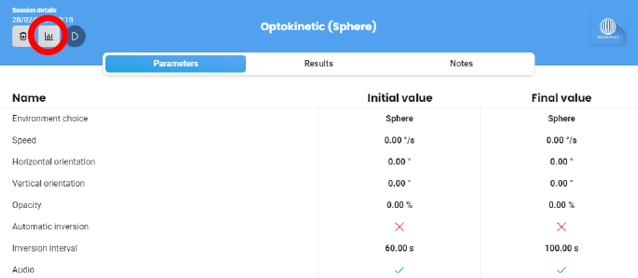
No default data points are displayed, but you can access other data points under “chart options.”
Presenter
