
How to create a report
This quick guide provides information on viewing patient results, creating a patient report, and exporting the report to a PDF. To view more detailed information, please reference the Patient Manager 3.0 User Manual.
Viewing patient results
Open the Virtualis application, and you will arrive at the home page.
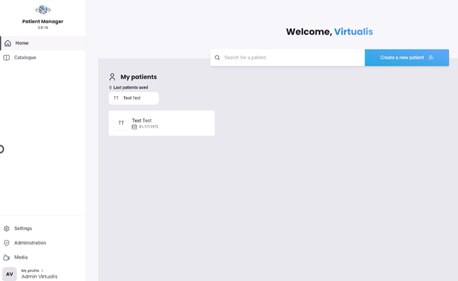
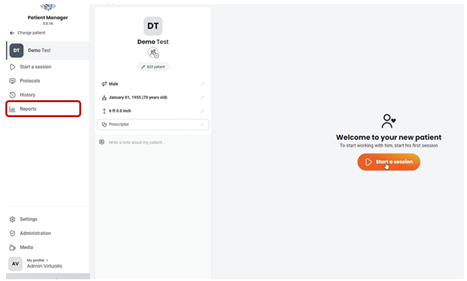
Select “Reports” on the left side of the screen.
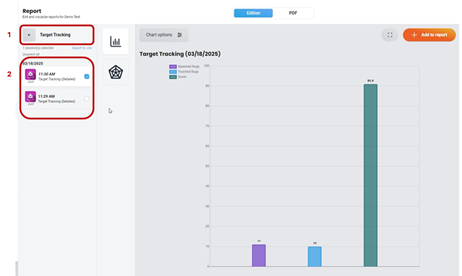
Start by selecting the software module, then choose one or more sessions to view the results.
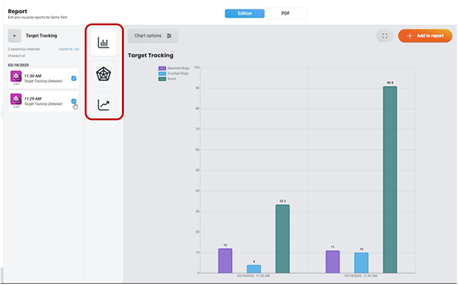
Change the graph type to display the results in a different format. The available graph options will vary based on the selected software module and the number of sessions.
Creating a patient report
Select the intended graph and click on the “+ Add to report” button in the upper right corner.
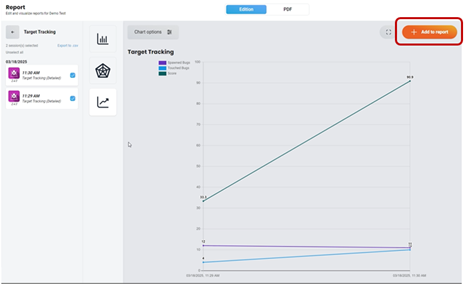
A number will appear on the PDF tab, indicating that the software module results have been added to the patient report.
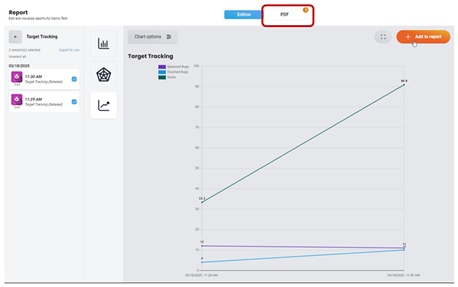
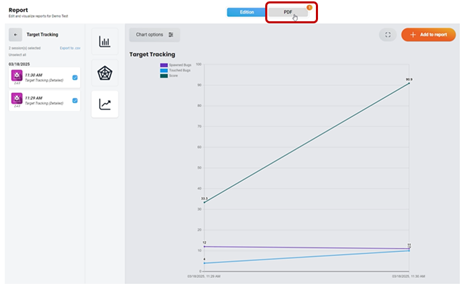
Continue to add patient results to the report by following the above steps. Once you have finished adding results to the report, view the report by clicking on the PDF tab.
Exporting the patient report to a PDF
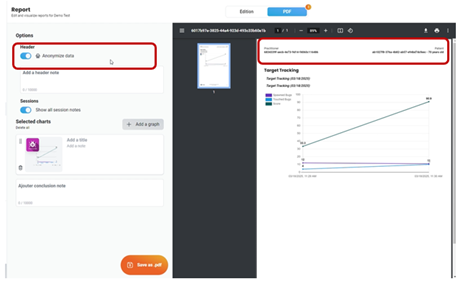
The PDF tab is divided into three sections:
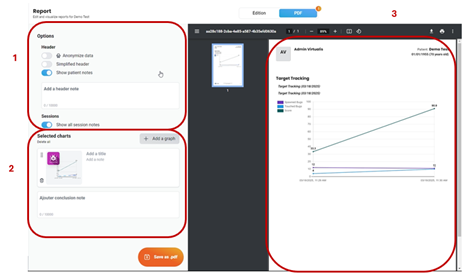
(1) PDF parameters, (2) Selected software modules and sessions, and (3) PDF print preview.
Select the parameters for your PDF. As you make selections, you will see real time changes to the PDF print preview.
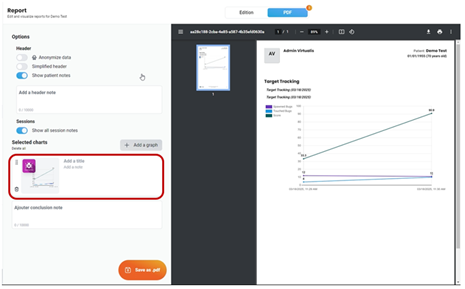
Organize the software module results by clicking and dragging the intended module.
You can also add additional software module results directly to the PDF by clicking “+ Add a graph”.
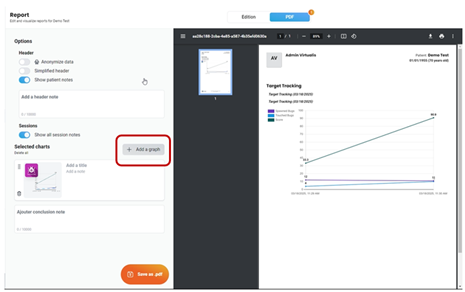
To remove a graph from the PDF, click on the trash can icon.
![]()
Once the report is created, you can save, download and/or print the PDF.
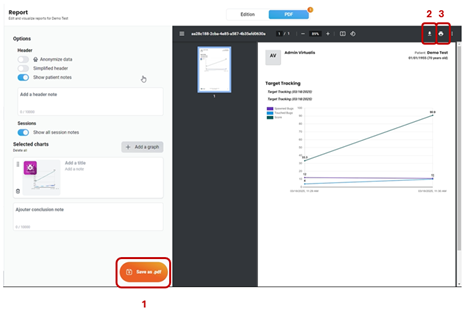
(1) Save PDF, (2) Download PDF, and (3) Print PDF.
Presenter
