
How to Perform the AirRaceVR Module
This quick guide provides information on how to perform the AirRaceVR module on the Virtualis PhysioVR solution. For additional information, please reference the AirRaceVR user manual.
Equipment needed
To view the equipment needed, click on the “i” icon in the upper right corner of the module. To perform the AirRaceVR module, you will need the VR headset. Note: this module is also compatible with the StaticVR and MotionVR force plates.
Patient setup
Depending on the patient’s therapeutic goals, they can sit or stand to perform this module.
1. Open a patient profile.
2. Click on “Start a session” to access the module list.
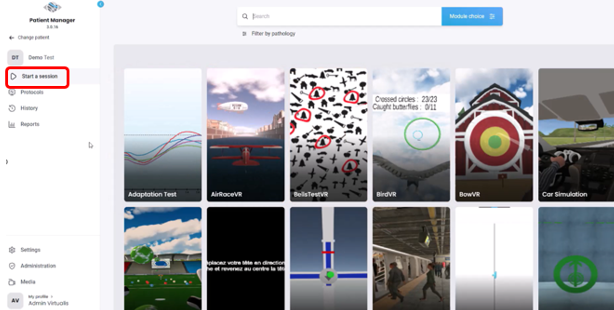
3. Type “AirRaceVR” in the search bar. The first three letters are often enough.
4. Click on the AirRaceVR button to launch the module.
5. Select the initial settings based on your patient’s therapeutic goals.
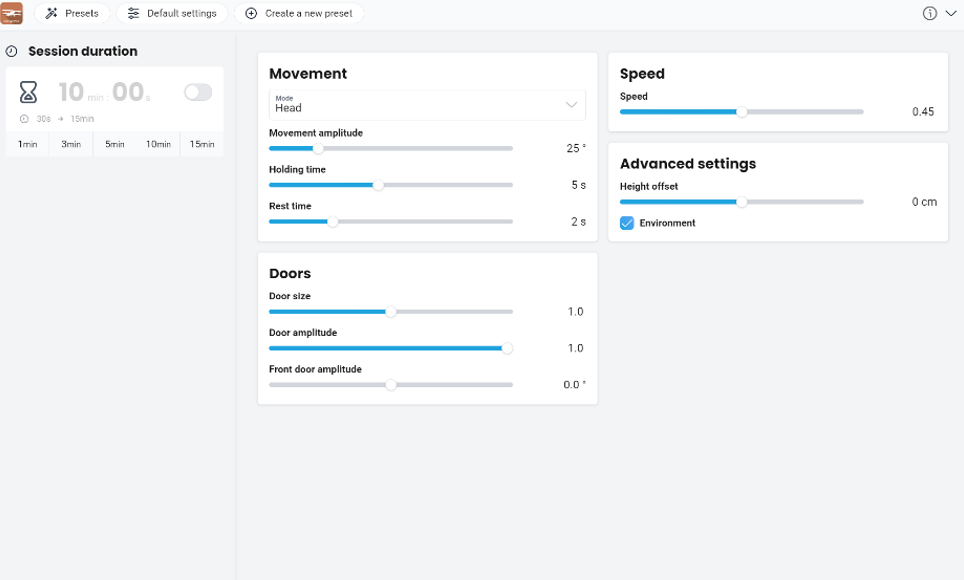
- Session duration (optional): select amount of time to perform the module.
- Movement:
- Mode:
- Head: use VR headset to perform cervical side bending motions.
- Back: use tracker to perform spine side bending motions.
- Center of pressure: use force plates to perform weight shifting.
- Movement amplitude: degrees of movement. Settings are dependent on which mode is selected.
- Holding time: seconds to hold end range movement.
- Rest time: seconds in between each movement.
- Mode:
- Doors: settings for targets:
- Size: width of target. 0.5 – 1.5 (default: 1.0).
- Amplitude: distance between targets. 0 – 1.0 (default: 1.0).
- Front door amplitude: change distance of front of target only. -3.3 – 3.3 degrees (default: 0 degrees).
- Speed: how fast the airplane moves through the environment. 0.3 – 0.6 (default: 0.45).
- Advanced settings:
- Height offset: change of airplane height (cm). -100 – 100 cm (default: 0 cm).
- Environment: when selected (default) provides a visual conflicting background. When not selected, provides a simple background.
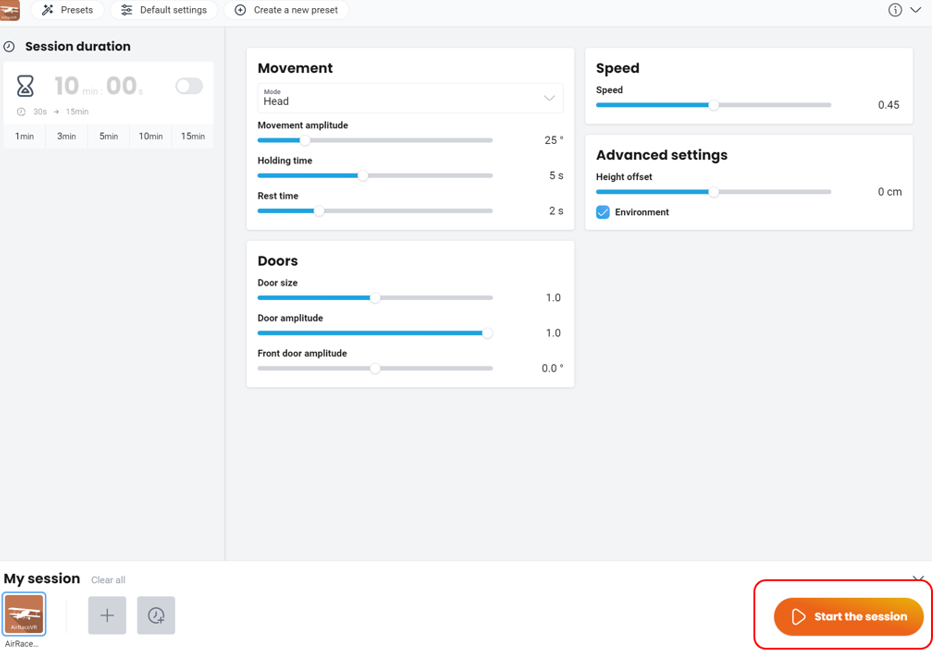
6. Once settings have been finalized, click on “Start the session”.
7. Before starting the module, have the patient look forward and press “C” on the keyboard to center the image inside the VR headset.
8. The goal of the module is dependent on your patient’s therapeutic goals (mobility, coordination, habituation of dizziness symptoms, etc.). You should monitor your patient’s symptoms closely throughout the activity.
9. Press “Start” to begin the module.

10. You can view the patient’s performance with objective data in the lower right corner including duration, score (%), and amplitude of movement selected (degrees).
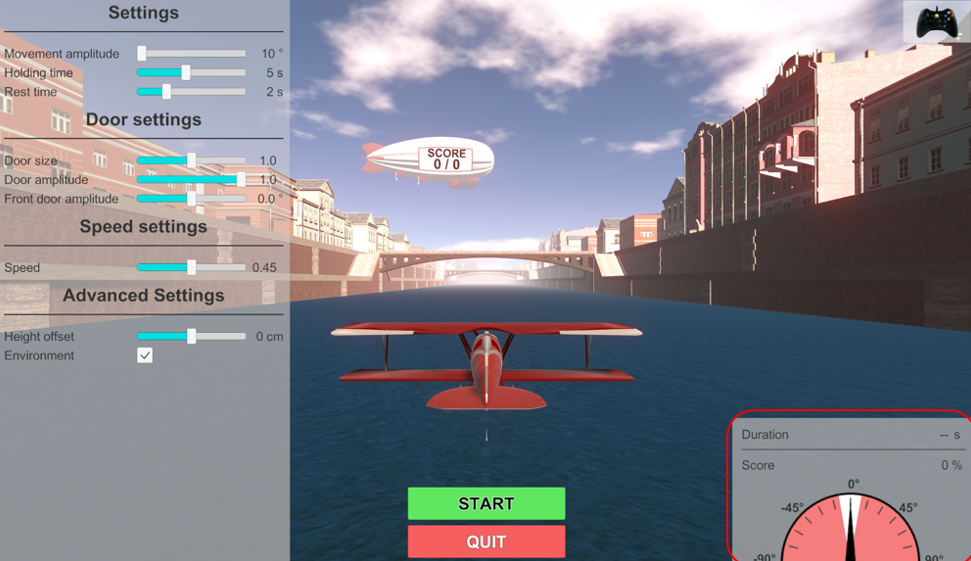
11. Perform real time progressions by changing the parameters on the left side of the clinician screen (see below). Note: the number of parameters is based on the path selected. Patients cannot see these adjustments.

In general, increasing the movement amplitude, hold time, door amplitude, and speed, or decreasing rest time and door size, increases the complexity of the activity.
12. Click the Xbox remote icon in the upper right corner to view information about shortcut keys.
13. Then you can view the results by clicking on the histogram icon.
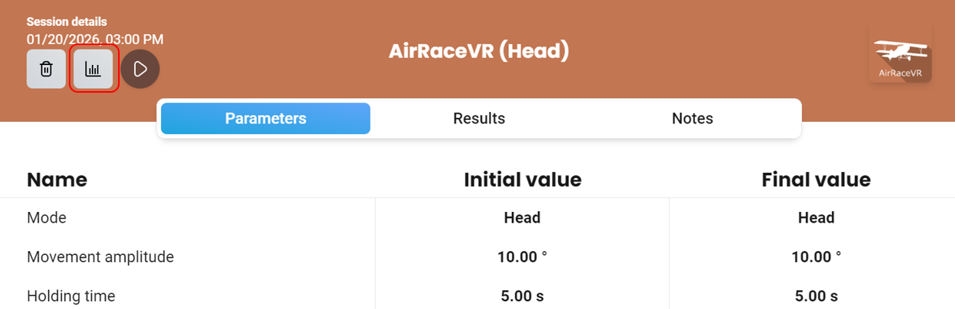
14. Score (%), number of correct doors passed through, and missed doors are the default result options which are displayed in a bar graph, radar plot, and/or line graph. You can select other results by clicking “chart options” on the top left of the screen.
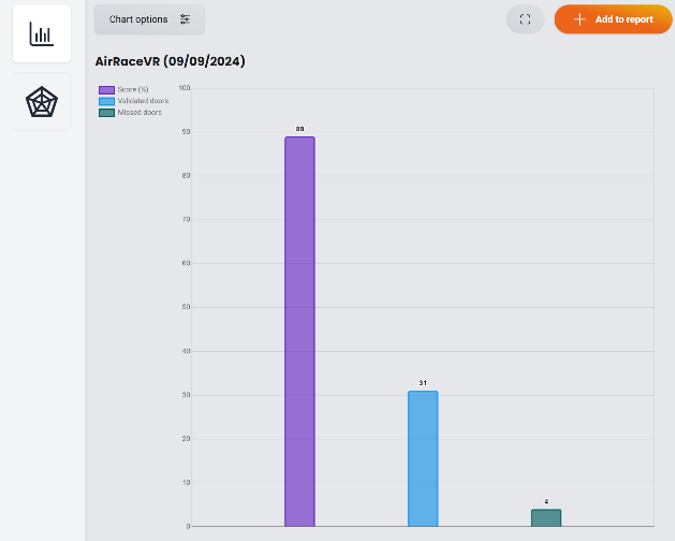
Bar graph: results for one session:
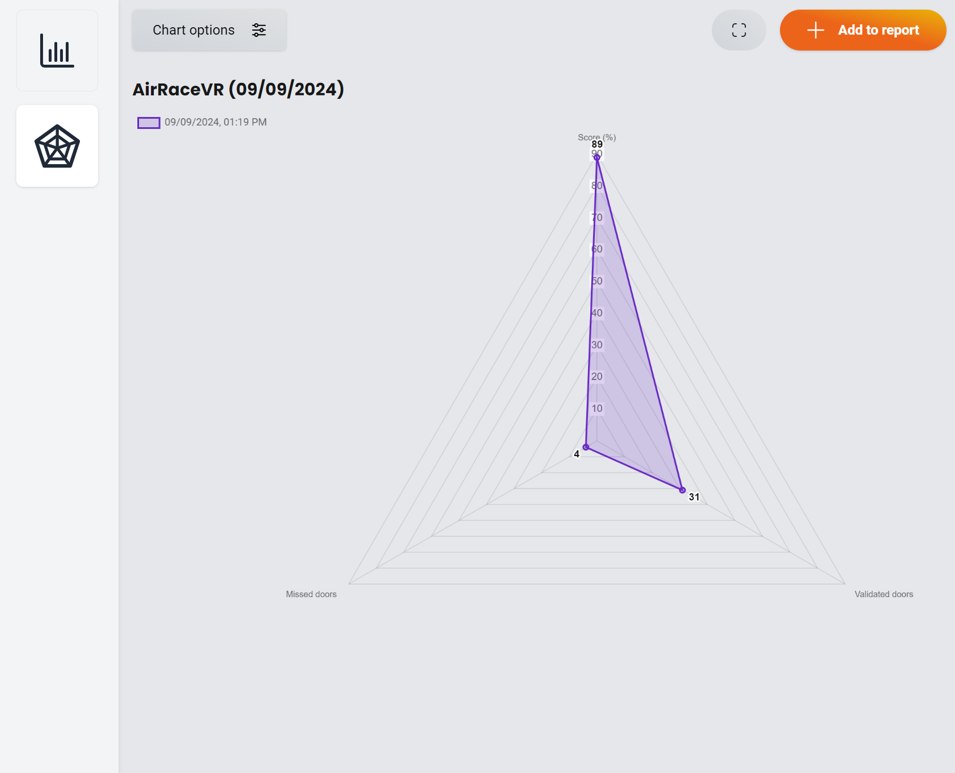
Radar plot: results for one session:
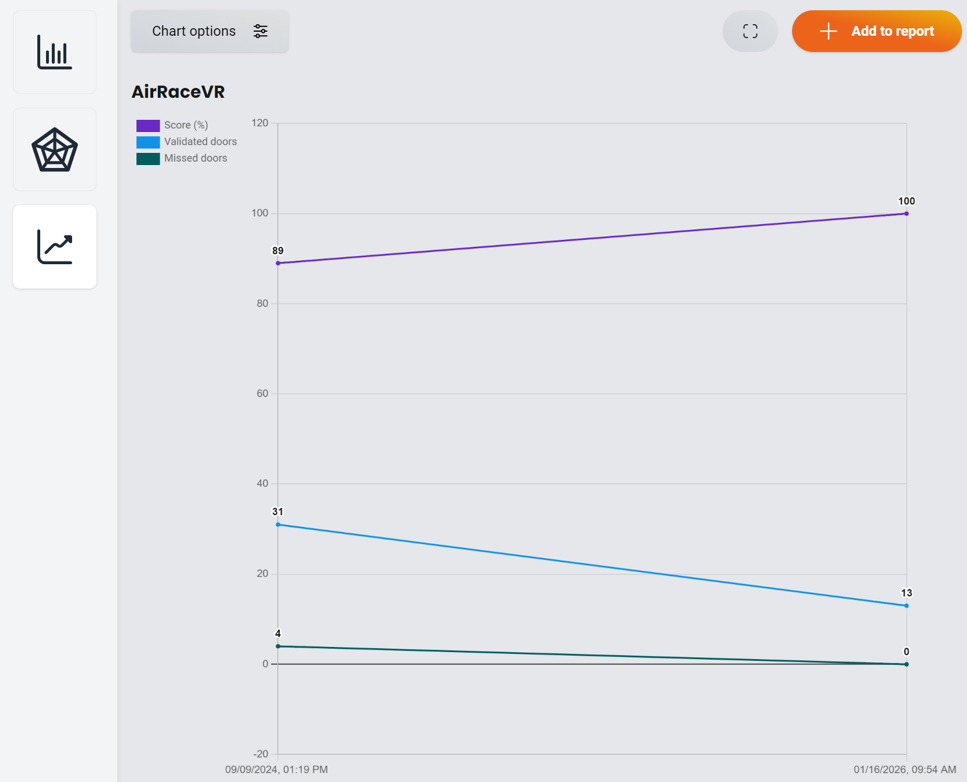
Line graph: comparing precision (%) over two sessions:
Presenter
