

Introduction to Tympanometry
This is an introduction to understanding and reporting on tympanometry measurements. You should use this guide should in conjunction with your own clinic’s protocols and current research in the area of acoustic immittance testing.
What is tympanometry?
Tympanometry is a test where both negative and positive pressure is applied to the middle ear alongside a constant probe tone. Tympanometry assesses how much of the probe tone is absorbed into the middle and inner ear, and how much is reflected. This allows clinicians to form a picture of how the tympanic membrane acts and functions.
What is a tympanogram?
A tympanogram is a graph produced by tympanometry. It shows the movement of the tympanic membrane and is most often cone-shaped. The peak of a tympanogram is where the eardrum is balanced between negative and positive pressure. By using a template such as Jerger’s classification, it is possible to determine if the tympanic membrane moves freely or if a disorder is present.
How to read a tympanogram?
To read a tympanogram, it is important to look at its shape and the values for ear canal volume, pressure, compliance (also known as admittance), and gradient.
1. Ear canal volume
“The equivalent ear canal volume (ECV) is an estimate of the volume of air medial to the probe, which includes the volume between the probe tip and the tympanic membrane if the tympanic membrane is intact, or the volume of the ear canal and the middle ear space if the tympanic membrane is perforated” (Fowler & Shanks, 2002, p. 180).
2. Tympanometric peak pressure (TTP)
Tympanometric peak pressure (TTP), also known as middle ear pressure (MEP), is the ear canal pressure at which the peak of the tympanogram occurs (Margolis & Hunter, 2000).
3. Static compliance
Static compliance (SC) “is the greatest amount of acoustic energy absorbed by the middle ear system (the vertical peak of the tympanic tracing)” (Onusko, 2004, p. 1716).
4. Gradient
“Tympanogram gradient is an objective measure that describes the steepness of the slope of the tympanogram near the peak” (Fowler & Shanks, 2002, p.182). The gradient is not commonly used in Australia to analyze tympanograms.
Tympanogram types (as proposed by Jerger)
Tympanogram types include: Type A (normal middle ear), Type B (indicative of pathology or fluid accumulation), Type C (suggestive of Eustachian tube dysfunction), Type As (hypomobile tympanic membrane), Type Ad (hypermobile tympanic membrane), and TM perforation (possible perforation or patent grommet). Understanding these types aids in diagnosing middle ear conditions.
You should look at tympanometry results in conjunction with other audiological results in the test battery – such as pure tone audiometry and speech audiometry – when giving recommendations in reporting.
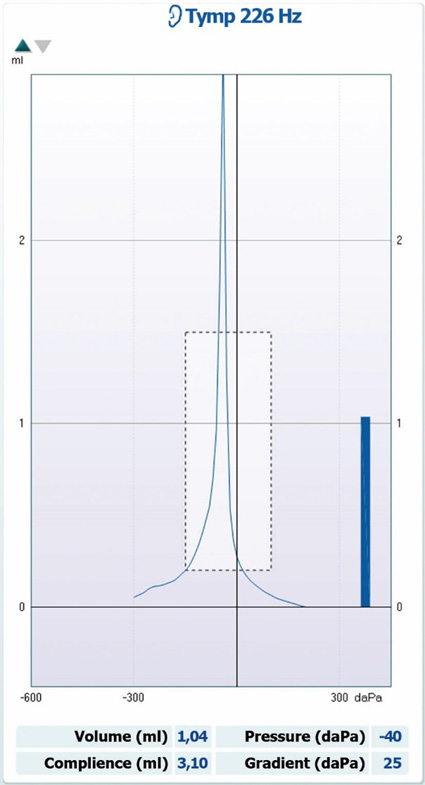
1. Type A tympanogram
Type A tympanograms show normal middle ear pressure and static compliance (Figure 1).
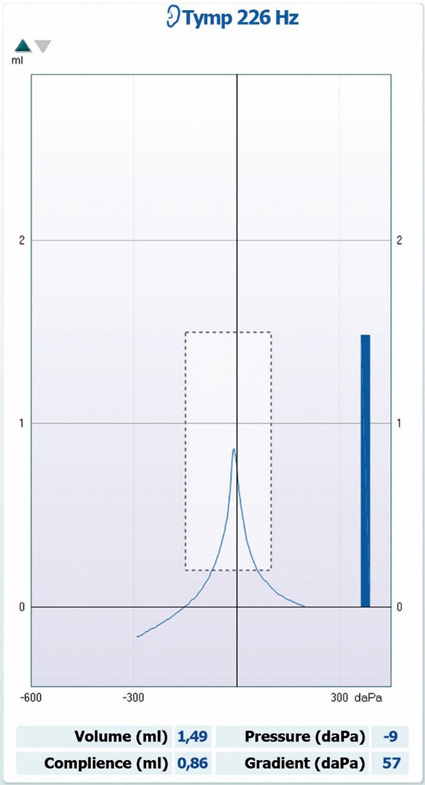
Type A tympanogram characteristics
- Sharp peak
- Ear canal volume within normal range
- Middle ear pressure between -99 to +50 mmH2O
- Static compliance between 0.3 to 1.6 cc in adults and 0.2 to 0.9 cc in children three to five years of age
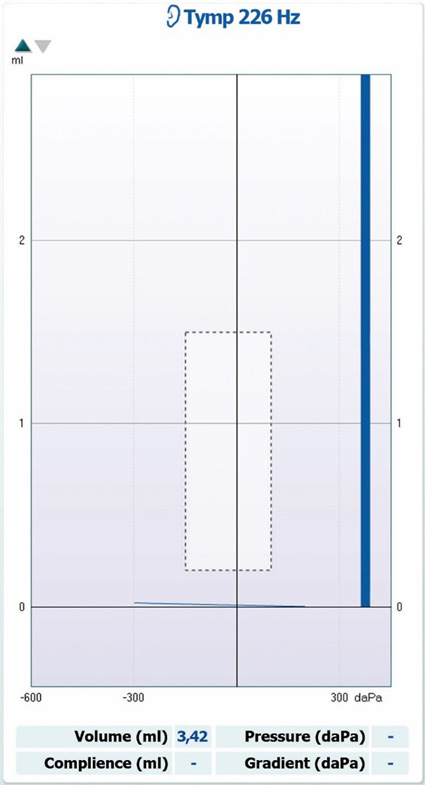
2. Type B tympanogram
Type B tympanograms show no measurable middle ear pressure or static compliance, consistent with middle ear pathology (Figure 2).
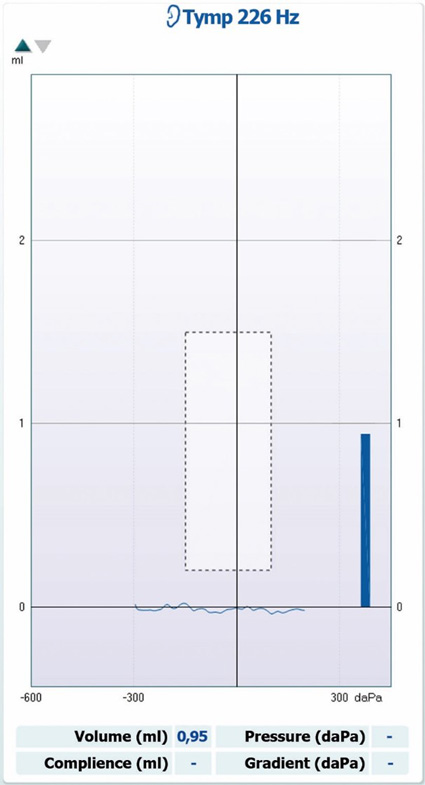
Type B tympanogram characteristics
- No peak
- Ear canal volume within normal range
- No measurable or reduced middle ear pressure and static compliance
3. Type C tympanogram
Type C tympanograms show significant negative middle ear pressure in the presence of normal static compliance, consistent with Eustachian tube dysfunction or middle ear pathology (Figure 3).
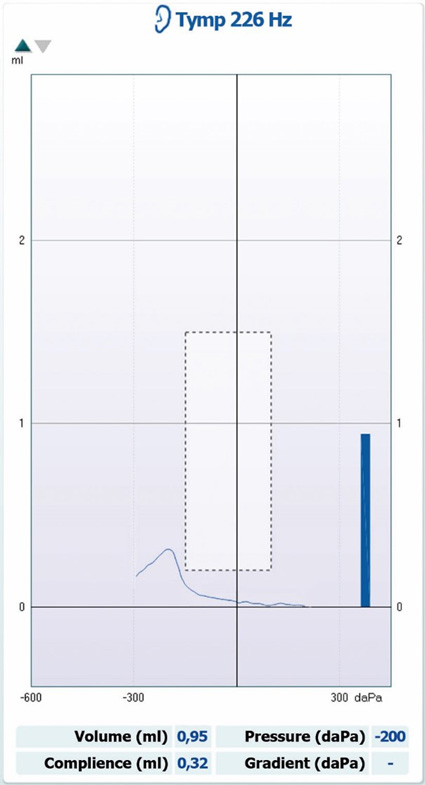
Type C tympanogram characteristics
- Sharp peak
- Ear canal volume within normal range
- Middle ear pressure less than -99 mmH2O
- Static compliance between 0.3 to 1.6 cc in adults and 0.2 to 0.9 cc in children three to five years of age
4. Type As tympanogram
Type As tympanograms show normal middle ear pressure with decreased static compliance, consistent with a hypomobile tympanic membrane (Figure 4).
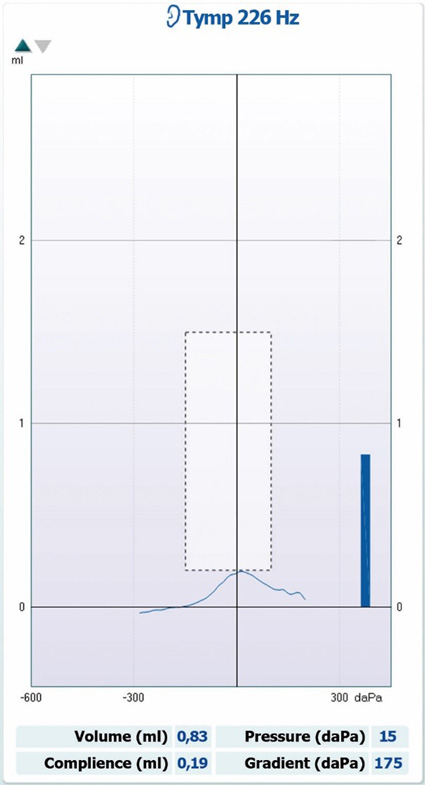
Type As tympanogram characteristics
- Sharp peak
- Normal middle ear pressure
- Ear canal volume within normal range
- Static compliance less than 0.3 cc in adults (hypomobile)
5. Type Ad tympanogram
Type Ad tympanograms show normal middle ear pressure with increased static compliance, consistent with a hypermobile tympanic membrane (Figure 5).
Type Ad tympanogram characteristics
- Sharp peak
- Normal middle ear pressure
- Ear canal volume within normal range
- Static compliance larger than 1.6 cc in adults (hypermobile)
6. Tympanic membrane (TM) perforation
Tympanometry results show a large ear canal volume, consistent with a tympanic membrane perforation or patent grommet (Figure 6).
TM perforation characteristics
- No peak
- Large ear canal volume
- No measurable or reduced middle ear pressure and static compliance
Reasons for repeating tympanometry
- Patient swallows, talks, laughs, coughs or similar during the test.
- You get an odd result that doesn’t look correct or doesn’t match audiogram findings.
References
Fowler, C. G., & Shanks, J. E. (2002). Tympanometry. In J. Katz (Ed.), Handbook of clinical audiology (5th ed.). (pp. 175 – 204). Baltimore: Lippincott Williams & Wilkins.
Margolis, R. H., & Hunter, L. L. (2000). Acoustic Immittance Measurements. In R. J. Roeser, M. Valente & H. Hosford-Dunn (Ed.), Audiology diagnosis. (pp. 381 - 423). New York: Thieme Medical Publishers, Inc.
Onusko, E. (2004). Tympanometry. American Family Physician, 70 (9), 1713 – 1720.
Srireddy, S. V., Ryan, C. E., & Niparko, J. K. (2003). Evaluation of the patient with hearing loss. In J. Niparko & L. R. Lustig (Ed), Clinical neurotology: Diagnosing and managing disorders of hearing, balance and the facial nerve. (pp. 65 – 80). London: Martin Dunitz Publishing.