

Acoustic Reflex Testing
What is the acoustic reflex?
The acoustic reflex is the contraction of the stapedius muscle elicited by the presentation of an acoustically loud sound. When either ear is presented with a loud sound, the stapedius muscles on both sides contract. Contraction of the stapedius muscle tilts the anterior stapes away from the oval window and stiffens the ossicular chain. This results in increased impedance which is measured as a small decrease in compliance by an ear canal probe. The stapedius muscle is innervated by the seventh cranial (facial) nerve (CNVII). Therefore, in the presence of CNVII paralysis, the stapedius muscle is likely to be affected.
Why perform acoustic reflex measurements?
Acoustic reflex results make a major contribution to differential diagnosis and should be part of every basic audiological evaluation. They can provide/confirm information about the type (conductive, sensory, neural) and degree of hearing loss.
An acoustic reflex will most likely be elicited if all of the following conditions are met:
- Normal middle ear function
- Loud enough stimulus to elicit the response
- No abnormal adaptation to stimulus
However, about 5% of the adult population have absent acoustic reflexes.
- The pure tone intensity range to elicit an acoustic reflex is 70 to 100dBHL (median = 85 dBHL)
- Ipsilateral ARTs in patients with normal hearing are usually 70-80dB above their pure tone thresholds, and about 5dB greater for their contralateral threshold (i.e., if pure tone thresholds were at 10dBHL, you would expect ipsilateral ARTs between 80 – 90dBHL and contralateral ARTs between 85-95dBHL as an approximation)
Contra-indicators for reflex testing
- Tinnitus
- Outer ear infection
- Severe recruitment
- Hyperacusis
How to setup the acoustic reflex protocol
1. Pathway
A protocol can be created to measure at either the ipsilateral pathway, contralateral pathway or both. Ipsilateral means “same side”, and contra means “opposite side”. The reflexes are always indicated by the probe ear.
Ipsilateral pathway
The ipsilateral pathway can best be explained as follows. The loud sound travels through the outer, middle and inner ear, then along the vestibulocochlear nerve (CNVIII) to the brainstem arriving at the cochlear nucleus. From here the signal travels to the superior olivary complex and to the CNVII nuclei. The signal is then sent down the CNVII causing contraction of the stapedius muscle.
Contralateral pathway
In the contralateral reflex pathway, the loud sound travels through the outer, middle and inner ear, then along the CNVIII to the brainstem arriving at the cochlear nucleus. From here the signal travels to the other superior olivary complex and the other CNVII nuclei. The signal is then sent down the CNVII causing contraction of the stapedius muscle.
2. Which probe tone should you use?
Generally a 226Hz probe tone is used unless neonates are being tested. In this case a high frequency probe tone is used (1000Hz).
3. Acoustic Reflex Threshold (ART)
The ART is the lowest intensity of an acoustic stimulus that elicits an acoustic reflex result (a measureable change in acoustic immittance). A change or deflection criteria of 0.03 is usually taken as the minimum change required to confirm the presence of a reflex.
4. Test frequencies
ART measurements are usually conducted at 500, 1000, 2000, 4000Hz. Results are variable at 4000Hz and many normal hearing young adults have elevated ARTs at this frequency. Therefore, results should be viewed with caution. Some clinicians prefer to use a Broadband Noise (BBN) as an alternate stimulus to 4000Hz. Generally, noise stimuli elicit reflexes at lower levels than pure tones do; approximately 20dB lower.
5. Intensity
The intensity should start from 70-80dBHL up to 105dBHL in 5dB steps until an acoustic reflex threshold is obtained. Depending on the required outcome of testing (screening vs clinical) it is not recommended to go above 105dBHL unless you suspect a conductive loss.
Note: Acoustic reflex testing can cause permanent hearing damage and tinnitus and while there are no standards for safe presentation levels, most of the literature recommends testing no higher than 105-110dBHL.
6. Positive or negative reflex display
Reflexes will either be displayed positively and negatively, depending on your setup of it.
|
|
|
|
A negatively displayed reflex |
A positively displayed reflex |
Acoustic reflex testing procedure
- Alert the client that they will hear some loud sounds in either ear.
- Ask them to sit still and quiet.
- Place the immittance probe (probe used for tympanometry) into the ear you want to test. Place the contralateral probe into the other.
- Perform tympanometry first. Acoustic reflexes should be measured with the ear canal pressure set to obtain maximum compliance in the presence of the 226Hz probe tone (i.e., after tympanometry).
- Press Start. The measure will then run a reflex growth and stop automatically when a reflex is present with thedefined threshold criteria. If the tone is loud enough and a contraction of the stapedius muscle occurs, the immittance probe will record that an acoustic reflex is present.
- The presence of a reflex is automatically confirmed by running the measure twice at the same intensity to confirm that the found threshold is reproducible. Alternatively, the measure can be repeated manually 5dB above the ART obtained to ensure it is a true.
Reasons for repeating reflex measurements
If any of the following occur during testing, it is wise to retest to confirm your results are true:
- Client swallows, talks, laughs, coughs during the test.
- You get an odd result that does not look correct or does not match audiogram findings.
- Collapsed canals can lead to false results, particularly if a headphone is used on the contralateral Recheck results if they look suspicious or do not fit with the other test battery of results.
Interpretation of acoustic reflexes
The reflexes are indicated by the probe ear, so when obtaining the reflexes for the right ear, the probe is placed in the right ear and the contra headphone is placed on the left ear.

When obtaining reflexes for the left ear, the probe is placed in the left ear with the contra headphone placed on the right ear.

What characteristics should you look for in your results?
- The presence or absence of the stapedial reflex
- An acoustic reflex threshold
- Acoustic reflex decay or adaptation (if tested)
The following is an example of what a reflex should look like. Here a deflection value is shown when a reflex is present. However, detection is based on the measurement matching an algorithm. It is therefore important for the clinician to look at the morphology of the reflex in conjunction with your testing situation (client talking, swallowing) and decide if the reflex is in fact a “true” reflex and not an artifact.

A reflex should show a downward deflection from 0.00 ml, which is time-locked to the stimulus presentation. It will then hold the change in compliance before offsetting back to 0.00 ml.
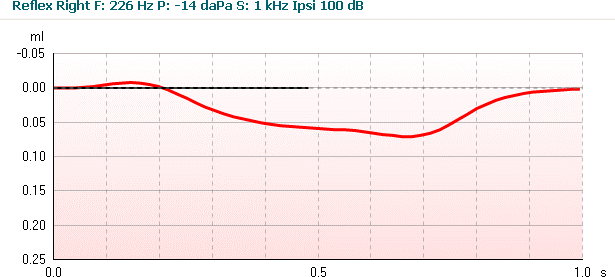
You will note in the example below that the reflex goes into the negative part of the graph before moving to the positive deflection point of 0.05ml. This type of response is called biphasic and can occur at the onset or both onset and offset of the reflex. The abnormal pattern of a biphasic response at both onset and offset is associated with otosclerosis, particularly in its early stages.
Examples of acoustic reflexes
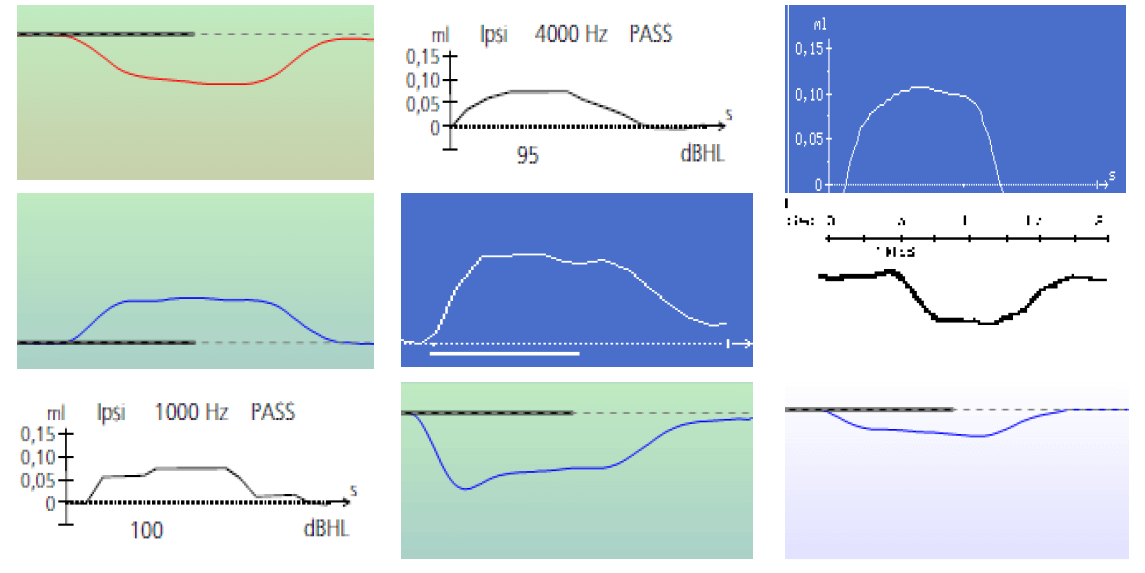
Examples of non-reflexes
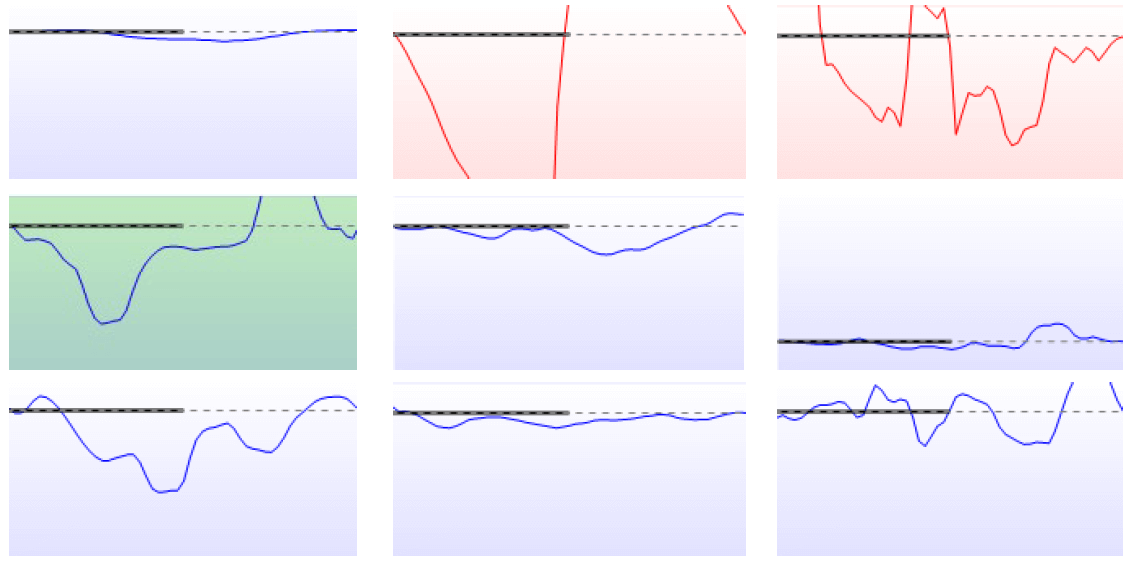
Why are these images not reflexes? In all but one example (highlighted green), the system has detected that these are not reflexes. In most of these examples, the client has either moved, swallowed or spoken during the test which has created an artifact.
In the first example, while it may appear to be a reflex, it has not been accepted as one because it has not met the deflection criteria as set by the instrument.
In the fourth (green highlighted) example, the system has detected this as a reflex, but in fact it is an artifact. You tell by looking at the shape that it does not match the pattern of a reflex. In this instance, you should repeat the test at that frequency to confirm the true ART.
Acoustic reflex patterns
Below are nine examples of reflex patterns you may come across during testing. However, you should be aware that these are not the results or patterns that you will see every time you test and real life clinical interpretations are much more complex. Different authors publish patterns or record results in different ways and therefore these tables below are a guide only.
Note that reflexes at 4000Hz may or may not be present due to variability at this frequency (discussed earlier). You may wish to use a BBN as an alternative to testing at 4000Hz.
Normal hearing and middle ear function
Generally for clients with normal hearing and normal middle ear function, both ipsilateral and contralateral reflexes will be present at all frequencies.
Example 1: Normal hearing/middle ear function
|
|
Freq |
.5kHz |
1kHz |
2kHz |
4kHz |
|
Probe R |
Stim R (ispi) |
85 |
85 |
85 |
85 |
|
Stim L (contra) |
90 |
90 |
90 |
90 |
|
|
Probe L |
Stim L (ispi) |
80 |
80 |
80 |
80 |
|
Stim R (contra) |
85 |
85 |
85 |
85 |
Conductive hearing loss
Acoustic reflexes will be absent when a probe is placed in an ear with a middle ear disorder. This is due to the fact that middle ear disorders typically prevent the probe from measuring a change in compliance when the stapedius muscle contracts. Reflexes will therefore be absent even in the case of a mild conductive hearing loss. In the presence of a Type C tympanogram, depending on the degree of negative pressure in the middle ear, reflexes can be either present or absent.
If acoustic reflexes are present in the probe ear, it is unlikely that a conductive hearing loss exists, except in the rare case of Superior Semicircular Canal Dehiscence (SSCD).
Example 2: Normal hearing in the right ear & a mild conductive loss in the left ear
|
|
Freq |
.5kHz |
1kHz |
2kHz |
4kHz |
|
Probe R |
Stim R (ispi) |
85 |
85 |
85 |
85 |
|
Stim L (contra) |
100 |
100 |
100 |
105 |
|
|
Probe L |
Stim L (ispi) |
X |
X |
X |
X |
|
Stim R (contra) |
X |
X |
X |
X |
In this example, the raised left contralateral reflex thresholds (probe right, stimulus left) are due to the additional SPL needed to overcome the mild loss in the L ear. The mild middle ear pathology may affect signals travelling through the left ear or being measured in the left ear. They will either be absent or raised.
Example 3: Normal hearing in the right ear & a moderate conductive loss in the left ear
|
|
Freq |
.5kHz |
1kHz |
2kHz |
4kHz |
|
Probe R |
Stim R (ispi) |
85 |
85 |
85 |
85 |
|
Stim L (contra) |
X |
X |
X |
X |
|
|
Probe L |
Stim L (ispi) |
X |
X |
X |
X |
|
Stim R (contra) |
X |
X |
X |
X |
In this example, because of the moderate loss in the left ear, the stimulus (even at max levels) was not loud enough to elicit the stapedius reflex in the left contralateral recording (probe right, stimulus left).
Cochlear hearing loss
In ears with a cochlear hearing loss, it is possible for the acoustic reflex to be elicited at sensation levels (SL) of less than 60dB. The SL is the difference between the ART and the hearing threshold. For example, if the hearing threshold at 1kHz is 50dBHL and the ART is 90dBHL, the sensation level is 40dBSL.
When the SL is less than 60dB, a positive Metz test is indicated. This indicates a cochlear site of lesion (sensorineural loss) due to the loudness recruitment phenomenon.
Example 4: A mild to moderate cochlear loss in both left & right ears
|
|
Freq |
.5kHz |
1kHz |
2kHz |
4kHz |
|
Probe R |
Stim R (ispi) |
85 |
80 |
80 |
100 |
|
Stim L (contra) |
85 |
90 |
90 |
X |
|
|
Probe L |
Stim L (ispi) |
85 |
90 |
85 |
100 |
|
Stim R (contra) |
90 |
80 |
85 |
X |
In this example, note that the ARTs occur at about normal levels. This is because the acoustic reflex threshold in an ear with a cochlear loss may resemble the results of a normal ear when the air conduction thresholds are below about 50dBHL. As the hearing threshold increases above this level, the chance of recording a raised or absent acoustic reflex increases.
Example 5: Severe to profound cochlear loss in left ear, normal hearing in the right ear
|
|
Freq |
.5kHz |
1kHz |
2kHz |
4kHz |
|
Probe R |
Stim R (ispi) |
85 |
85 |
85 |
95 |
|
Stim L (contra) |
X |
X |
X |
X |
|
|
Probe L |
Stim L (ispi) |
X |
X |
X |
X |
|
Stim R (contra) |
90 |
90 |
90 |
95 |
In this example, the stimulus (even at max levels) was not loud enough to elicit a stapedius reflex due to the severe/profound loss in the left ear. Therefore, whenever a stimulus is presented to the affected ear, reflexes will be absent/raised in both ipsilateral and contralateral recordings as shown above.
Retrocochlear hearing loss
ARTs in ears with retrocochlear (CNVII) pathology are usually elevated above what they would have been for normal hearing or a cochlear hearing loss. Often they are absent at maximum stimulus levels. Keep in mind that ART results should be analyzed in combination with the patient case history, audiogram, speech and tympanometry findings for differential diagnosis.
Some things to note:
- Ears with retrocochlear pathology and normal hearing do not have reflexes 30% of the time
- With a mild 30dB hearing loss, the likelihood of absent reflexes increases
- The absence of reflexes at 0.5, 1 & 2kHz in the presence of normal/near normal hearing must be considered suspicious unless proven otherwise
- The affected ear will show absent acoustic reflexes when a stimulus is presented to it in the case of CNVIII lesions
Example 6: Retrocochlear lesion in the left ear; normal hearing in both ears
|
|
Freq |
.5kHz |
1kHz |
2kHz |
4kHz |
|
Probe R |
Stim R (ispi) |
80 |
80 |
80 |
90 |
|
Stim L (contra) |
105 |
110 |
X |
X |
|
|
Probe L |
Stim L (ispi) |
110 |
X |
X |
X |
|
Stim R (contra) |
85 |
80 |
85 |
95 |
In this example, note the raised/absent acoustic reflexes with presentation to the left ear.
Example 7: Retrocochlear/CNVIII lesion in the left ear; a mild hearing loss in the left ear & normal hearing in the right ear
|
|
Freq |
.5kHz |
1kHz |
2kHz |
4kHz |
|
Probe R |
Stim R (ispi) |
80 |
80 |
85 |
85 |
|
Stim L (contra) |
X |
X |
X |
X |
|
|
Probe L |
Stim L (ispi) |
X |
X |
X |
X |
|
Stim R (contra) |
85 |
85 |
90 |
90 |
In this example, note the absent acoustic reflexes when sound is presented to the left ear.
Facial nerve/CNVII involvement
Acoustic reflexes are absent when measured on the affected side in the case of a facial nerve disorder (e.g., probe in the affected ear). This is because the stapedius muscle is innervated by the CNVII.
Often, CNVII disorders are easily recognizable (e.g., facial paralysis in the case of Bell’s Palsy) and measurement of the acoustic reflex is used as a tool to monitor the recovery process in such patients.
Example 8: Facial nerve/CNVII lesion in the left ear due to Bell’s Palsy; normal hearing in both ears
|
|
Freq |
.5kHz |
1kHz |
2kHz |
4kHz |
|
Probe R |
Stim R (ispi) |
80 |
80 |
85 |
85 |
|
Stim L (contra) |
85 |
85 |
85 |
90 |
|
|
Probe L |
Stim L (ispi) |
X |
X |
X |
X |
|
Stim R (contra) |
X |
X |
X |
X |
In this example, note that the acoustic reflexes are absent when the probe is coupled to the affected (left) ear. Also, you will recognize this is a similar pattern of results for a CNVIII lesion.
Inter-axial brainstem lesion
- Very rare. About 1 in 10 million
- Acoustic reflexes are normal ipsilaterally and absent contralaterally. The left and right pathways are disrupted by a lesion involving the auditory fibers.
Example 9: Intra-axial brainstem lesion; normal hearing in both ears
|
|
Freq |
.5kHz |
1kHz |
2kHz |
4kHz |
|
Probe R |
Stim R (ispi) |
80 |
80 |
85 |
85 |
|
Stim L (contra) |
X |
X |
X |
X |
|
|
Probe L |
Stim L (ispi) |
85 |
80 |
80 |
85 |
|
Stim R (contra) |
X |
X |
X |
X |
What is acoustic reflex decay testing?
Reflex decay testing can be useful in detecting/confirming retrocochlear pathology in patients. Generally patients will present with typical retrocochlear indicators (unilateral tinnitus, asymmetrical hearing loss, dizziness/vertigo) and you will have enough information to warrant a referral to an ENT specialist without needing to do this test. This test may be useful though when the audiogram and case history are normal, but reflex results show a retrocochlear pattern.
An acoustic reflex decay test measures whether a reflex contraction is maintained or weakens during continuous stimulation (usually 10 seconds). Testing is usually conducted at 500Hz and 1000Hz, but not above these frequencies as even normal ears can show decay at higher frequencies.
The test is performed by presenting a continuous stimulus 10dB above the ART for that frequency for a period of 10 seconds. Either the magnitude of the reflex response will stay the same or decrease over the 10 second period. What you are looking for is whether or not the response decays to half its original magnitude. Therefore, if the reflex response decreases to 50% of its original magnitude within the 10 seconds of testing, the test would be positive for reflex decay.
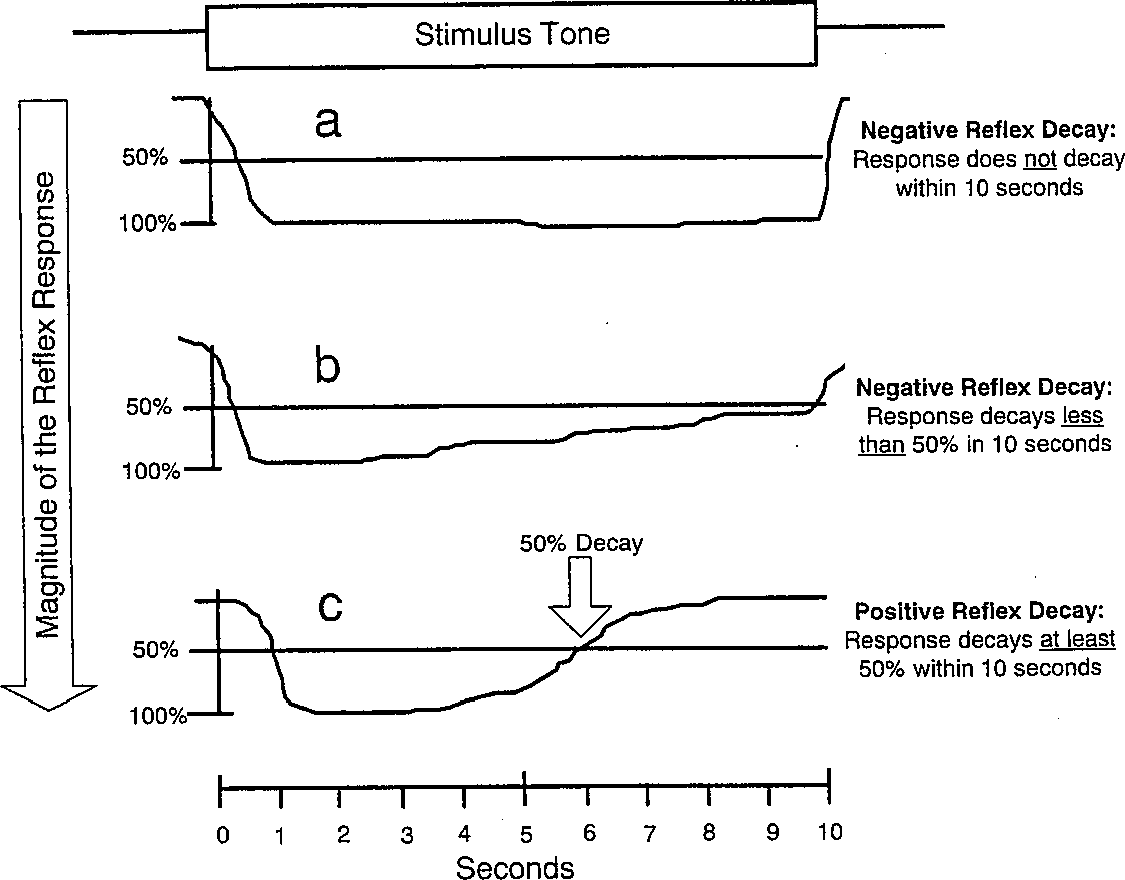
In the figure above (taken from Gefland, 2001), the acoustic reflex decay is considered negative if the reflex response does not decrease (example a) or if it decreases by less than half of its original magnitude (example b). Reflex decay is positive if the magnitude falls by 50% or more (as in example c).
Acoustic reflex decay test procedure
- Perform tympanometry and reflex measurements
- Take the acoustic reflex threshold at 500Hz or 1000Hz in the ear you want to test and add 10dB. This is the stimulus level you will use for testing (e.g., if the reflex threshold was 80dB at 1000Hz, you would test at 90dB at 1000Hz). The intensity is set automatically 10dB above the found reflex
- Make sure you still have a good seal between the probe and the ear and then press start to run the test
Note: If the reflex decay test is positive, you should check that it was not due to an improper seal, which might produce an artifact similar to a decaying curve.
Interpretation of the acoustic reflex decay test
Look at the recorded measurement. Typically you will see a result similar to the example below.
The decay value is the percentage difference of the two reflex deflection values taken half a second after the stimulus started and half a second before the stimulus stopped.
|
|
 |
|
Example 1. In this example, the reflex decay test is negative as the response did not decay by more than 50% (drop below green dotted line), during the 10 second test interval. The blue reflex line would have had to drop below the green dotted line for positive reflex decay to be measured. |
Example 2. This example shows a positive reflex decay measurement. The reflex has decayed by more than 50% (indicated by the green dotted line) during the 10 seconds test interval. |

References
Bess, F.H., & Humes, L.E. (2003). Audiology: The Fundamentals (3rd ed.). Baltimore: Lippincott Williams & Wilkins.
Campbell, K.C., & Mullin, G. (2006). Impedance audiometry.
Emmanuel, C. D. (2009). Acoustic reflex threshold (ART) patterns: An interpretation guide for students and supervisors.
Fowler, C. G., & Shanks, J. E. (2002). Tympanometry. In J. Katz (Ed.), Handbook of clinical audiology (5th ed.). (pp. 175-204).
Gefland, S.A. (2001). Essentials of audiology (2nd ed.). New York: Thieme Medical Publishers, Inc.
Margolis, R. H., & Hunter, L. L. (2000). Acoustic Immittance Measurements. In R. J. Roeser, M. Valente & H. Hosford- Dunn (Ed.), Audiology diagnosis. (pp. 381 - 423). New York: Thieme Medical Publishers, Inc.
Srireddy, S. V., Ryan, C. E., & Niparko, J. K. (2003). Evaluation of the patient with hearing loss. In J. Niparko & Lustig (Ed), Clinical neurotology: Diagnosing and managing disorders of hearing, balance and the facial nerve. (pp. 65-80). London: Martin Dunitz.
Zito, F., & Roberto, M. (1980). The acoustic reflex pattern studied by the averaging technique. Audiology, 19, 395-403.