
Electrocochleography
What is electrocochleography?
Electrocochleography, also abbreviated as ECochG or ECOG, is a measure of the electrical potentials of the cochlea. Typically, the measurement is characterized by the stimulus onset (baseline - BL), the response of the cochlea to the stimulus (summating potential - SP), and response to the synchronous firing of nerve fibers (action potential - AP). The AP is also known as Wave I.
The cochlear microphonic (CM) is also part of electrocochleography and has its own protocol. Measuring the CM requires slightly different test parameters than the SP and AP, why it is described in a separate guide.
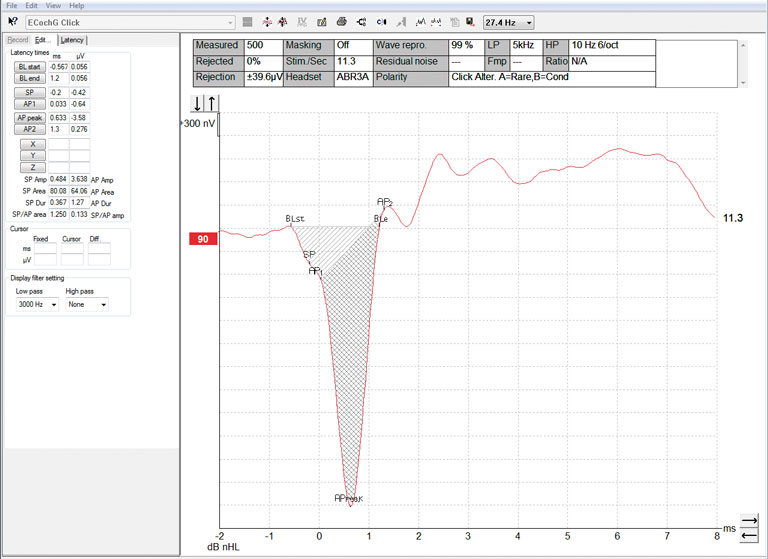
See Figure 1 for an example of an electrocochleogram.
Why perform electrocochleography?
Electrocochleography can be helpful when diagnosing certain vestibular and auditory conditions. It is primarily used to diagnose Meniere’s disease and cochlear hydrops in particular. The SP and AP amplitudes, latencies, and their relationship are used to diagnose these conditions. Perilymphatic fistula (PLF), sudden hearing loss, and other pathologies may result in abnormal electrocochleography results. Superior canal dehiscence (SCD) may also result in elevated SP/AP ratios [1].
Electrode choice
Surface electrodes are not adequate for electrocochleography. It is recommended to use TipTrodes, TM‑trodes or transtympanic electrodes to measure the electrocochleogram. Transtympanic electrodes will result in the most robust response but are not feasible for most clinics. Gold foil TipTrodes are sometimes used but TM-trodes will produce larger responses as they are closer to the site of generation.
Preparing for the test
Please observe the following before performing the test:
[1] Your patient should lie down and be relaxed or sleeping in a quiet environment.
[2] Examine the ear canal and tympanic membrane for any contraindications.
[3] Prepare and clean the electrode sites to get low skin impedance. The impedance values for each electrode should be about the same. For TipTrodes, the impedance values should be 5 kiloohms or lower. For TM-trodes, the impedance values should be 20 kiloohms or lower. It may be quite difficult to achieve impedance values that low on the test-ear electrode, where you may accept higher levels.
Electrode placement
Prepare the electrode and test ear before placement.
For TM-trodes, drain the ear before inserting them into the ear. To reduce impedance, you can place the TM-trode in a saline solution before insertion and also dip it in electrode contact gel.
For TipTrodes, use a cotton swab with a bit of NuPrep to gently clean the ear canal. Then cover the TipTrode in conductive gel and insert it in the patient’s ear while gently squeezing it.
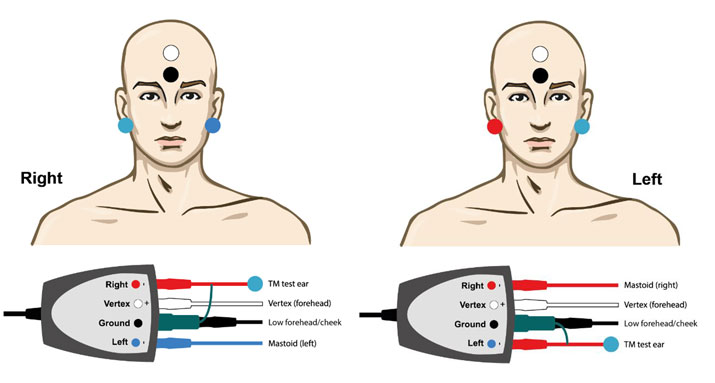
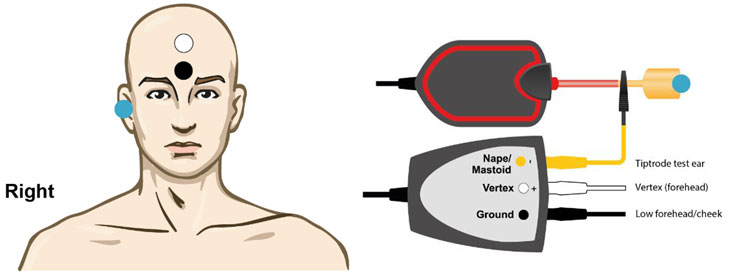
EPA4 TM-trode example
When using EPA4 together with a TM-trode, move the red TM-trode cable when switching ear (Figure 2).
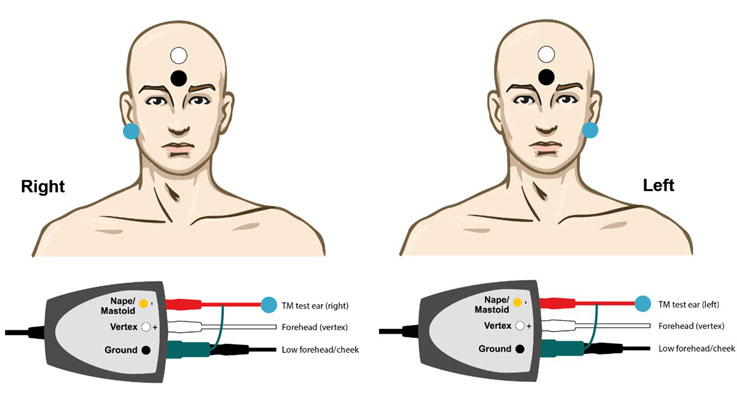
EPA3 TM-trode example
You only need one channel to perform electrocochleography with the TM-trode, meaning you also can use EPA3 (Figure 3).
EPA4 TipTrode example
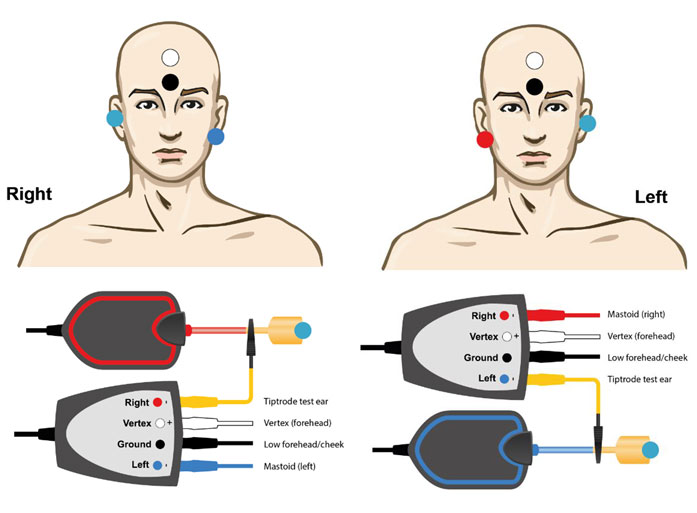
EPA3 TipTrode example
Basic electrocochleography procedure with the Eclipse
The procedure discussed below is a suggested process you can use as a guideline. Consult the Eclipse documentation to learn how to create or change a protocol.
- Choose the protocol ‘ECochG Click’.
- To being the manual mode, choose the intensity and select the ear to test on the record sheet.
- Press Start or F2 to start recording.
During testing, check the EEG to assure a collection with minimal noise. The EEG levels should be low and consistent. As averaging commences, the waveform will appear on the screen.
You can increase or decrease waveform scaling by using the arrows on the top left side of the recording window or on your keyboard. You can also change window sizing by selecting one of the arrow keys on the bottom right side of the recording window or using the arrows on your keyboard.
Marking peaks and areas
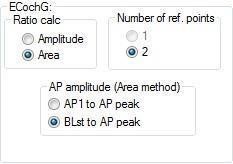
You can mark waveforms from the edit sheet during or after testing either manually or automatically. The Eclipse software will automatically calculate the amplitude and area ratios once the waveform is marked with the required labels. You can find the ratio selection in the general setup (Figure 6).
To mark a selected waveform, click the appropriate waveform marker in the edit sheet (or select 1 to 6 on the keyboard). Now, bring the mouse to the correct position on the waveform and click to place the marker (or hit enter).
You can use the digital filters to clean up noisy data even after a completed test or run. You’ll find this feature in the bottom of the edit sheet.
Amplitude ratio
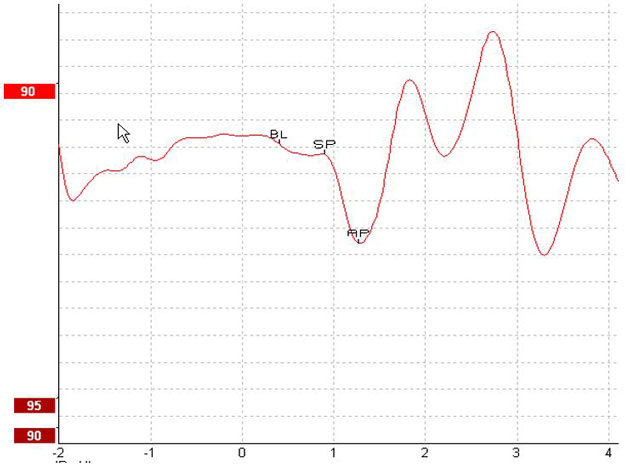
Amplitude ratio is marked with the baseline (BL), the summating potential (SP), and the action potential (AP). The system automatically calculates a ratio between the BL/SP and BL/AP. SP/AP amplitudes exceeding a ratio of 0.53 are abnormal [1]. See Figure 7 for the points marked to calculate the amplitude ratio.
Area ratio
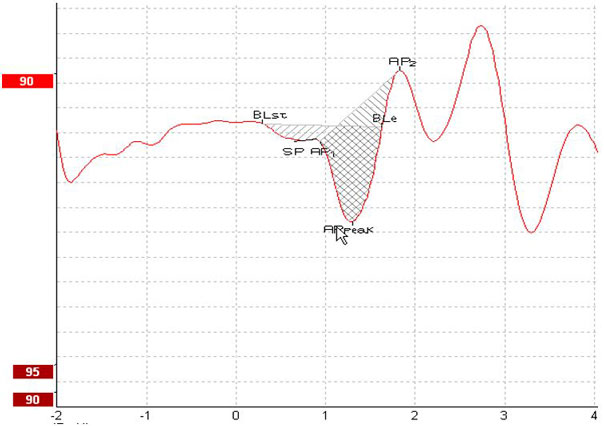
Area ratio is marked by first marking the start of the baseline (BLst). The end of the baseline (Ble) will automatically be marked at the next point in the waveform where the amplitude crosses this baseline. If the waveform does not allow this, you can place the BLe manually.
Now, mark the SP and the AP1 (the beginning of the AP). Next, mark the AP peak. Finally, mark the AP2, which is where the AP ends and ‘changes direction’. A ratio is calculated automatically by the system. SP/AP area ratios exceeding a ratio of 1.94 are abnormal [1]. See Figure 8 for the points marked to calculate the area ratio.
References
[1] Devaiah AK, Dawson KL, Ferraro JA, Ator GA. Utility of Area Curve Ratio Electrocochleography in Early Meniere Disease. Arch Otolaryngol Head Neck Surg. 2003;129(5):547–551.