
Otoacoustic Emissions (OAEs): A Complete Guide
Description
This guide provides clinicians with a complete introduction to OAE testing to help in the selection of the most appropriate test protocol and for analyzing OAE test results.
Table of contents
- What are otoacoustic emissions (OAEs)?
- Types of OAEs
- Screening vs diagnostic OAE
- OAE equipment
- Pre-test examinations and instructions
- Selecting the right test protocol and settings
- Before and during OAE testing
- Analysis and interpretation of the results
What are otoacoustic emissions (OAEs)?
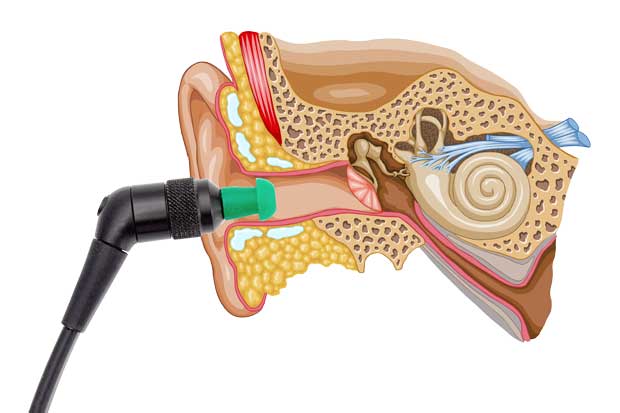
Otoacoustic emissions (OAEs) are sounds produced by the movement of outer hair cells within a properly functioning cochlea when stimulated by external sounds. These emissions can be measured using a specialized probe equipped with speakers and a microphone, placed in the external auditory canal (ear canal). OAEs serve as indicators of the outer hair cells' integrity and function within the cochlea, providing valuable insights into auditory health.
A healthy outer ear and middle ear are also required to accurately record these small amplitude sounds which can vary from -10 dB SPL to +30 dB SPL in healthy functioning ears.
OAEs are not a test of hearing and cannot estimate the type or degree of hearing loss as with pure tone audiometry or auditory steady-state response (ASSR) testing. But they are an essential tool in both newborn hearing screening and diagnostic audiology for the differential diagnosis of hearing conditions.
Types of OAEs
Otoacoustic emissions are either spontaneous or evoked. Spontaneous otoacoustic emissions (SOAEs) occur in the ear without external stimulation while evoked OAEs are measured after the presentation of a stimulus to the ear. OAEs are evoked using a transient stimulus such as a click or tone burst (TEOAE), using a pure-tone stimulus (SFOAE) or using a pair of pure-tone stimuli (DPOAE).
The most recorded OAEs in screening and diagnostic audiology are distortion product otoacoustic emissions (DPOAEs) and transient evoked otoacoustic emissions (TEOAEs).
DPOAEs
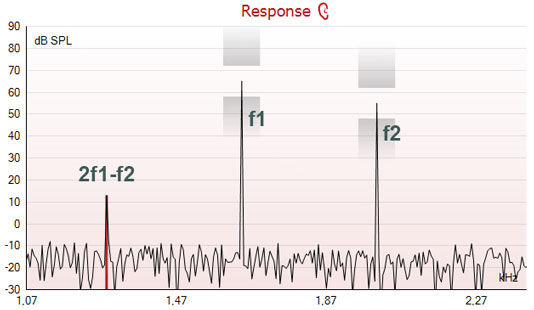
Distortion product otoacoustic emissions are evoked by the simultaneous presentation of two pure tones or primaries, referred to as f1 and f2. Because the cochlea is non-linear in nature, distortion occurs at various places along the cochlea during stimulus presentation. During a DPOAE test, various pairs of stimuli are presented to the ear and the largest corresponding distortion product is simultaneously measured at the frequency mathematically expressed as 2f1-f2.
The main test frequency is usually referred to as f2. For example, if 2000 Hz was the desired OAE test frequency, then f2 = 2000 Hz and f1 = 1640 Hz (a fixed ratio is used to determine the f1). Using the mathematical equation of 2f1-f2, the largest corresponding distortion product would appear at 1280 Hz (2 x 1640 minus 2000) in a healthy functioning cochlea.
The location in the cochlea that generates the distortion product(s) is close to the place of largest amplitude of the f2 stimulus. Thus, despite the actual distortion product frequency being lower than f2, the level of the distortion product is indicative of the health/activity of the cochlea at the f2 place.
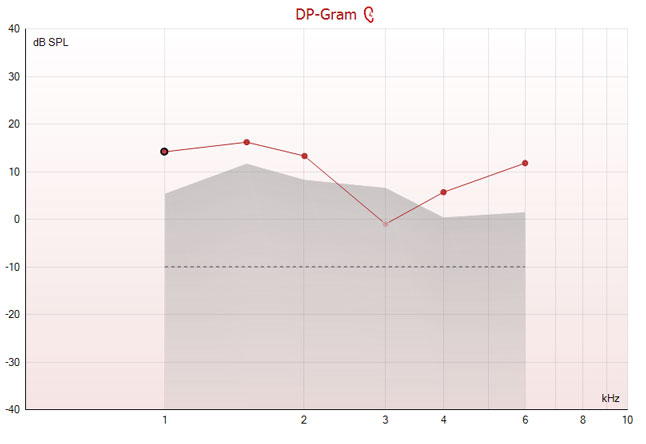
DPOAE normal range
DPOAEs are typically recorded between 1 to 6 kHz but can be recorded as high as 10 to 12 kHz depending on equipment capabilities.
TEOAEs
Transient evoked otoacoustic emissions are most commonly evoked using a repeated broadband click stimulus. They are recorded during the brief intervals between the stimulus presentations that activate a wide area of the basilar membrane.
Recording of the TEOAE response occurs during the presentation of a train of biphasic clicks. By keeping the stimulus click short, this method of stimulus delivery facilitates the separation of the response from the much louder stimulus.
Because the response from a healthy ear contains the same frequencies as the stimulus, several techniques have to be employed to ensure that the measured response is not in fact some of the ‘leftover’ energy from the stimulus click. Note, this contrasts with DPOAE measurements where the response is at a different frequency to the stimuli and is therefore easy to distinguish.
TEOAE equipment typically use a combination of time windows, filtering and a sequence of stimuli presented at different levels and polarity to ensure that the TEOAE response originates from the cochlea. Due to the small size of the TEOAE response, many repeated stimuli are necessary, and the process of ‘averaging’ allows the response to be observed above the noise level. Often, these TEOAE responses are then averaged alternately into two response pools (referred to as A and B buffers) so that various time and frequency domain correlations can be performed to characterize the performance of the cochlea.
TEOAE response latencies are typically recorded in the range of 2 – 23 ms. The shorter latencies represent the higher frequency region of the cochlea, while the longer latencies reflect the lower frequency regions. This corresponds to the anatomy and physiology of the cochlea whereby the high frequency sounds only propagate a short distance along the basilar membrane whereas low frequencies travel further towards the apex and thus take longer to be reflected back to the probe.
Screening vs diagnostic OAE
The application of OAEs in screening is very different to that when used for diagnostic purposes. It is important to select the correct test settings or protocol, depending on the patient or expected use of the test results.
Screening
In screening, the goal is to separate persons with an auditory disorder that will interfere with communication, from those who do not have a communicatively important auditory disorder.
While OAEs do not test the entire auditory pathway, they play a major role in newborn hearing screening as they:
- Are sensitive to, and dependent on, outer hair cell function
- Do not need a behavioral response
- Provide ear-specific information
- Are a fast and inexpensive test
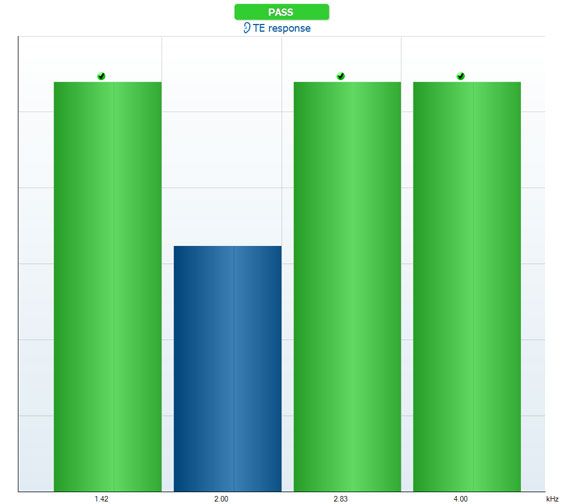
In screening, results are displayed as either a PASS or REFER and test protocols typically require that 3 out of 4 bands or frequencies (in the speech frequency range) are detected for a PASS result. When the newborn passes the hearing screening test, it indicates that there is a significantly low chance that they have a significant auditory disorder requiring amplification.
A REFER result only indicates that the detection criteria of the test protocol was not met. This could be due to test conditions (too noisy), a hearing loss (conductive or sensorineural) or poor testing techniques.
Infants that REFER on a screening test may be rescreened before being referred to a diagnostic audiology department for more thorough testing to rule out a permanent hearing loss.
Diagnostics
A test battery approach is commonly used in diagnostic audiology to get the big picture about a patient’s hearing condition. While the pure-tone audiogram, a common diagnostic tool, gives us the patient’s degree and type of hearing loss, it is insensitive to many important aspects of hearing and listening ability, particularly when the patient is in a challenging listening situation.
Other tests such a speech audiometry, otoacoustic emissions and impedance measurements can help complete the bigger picture about a patient’s hearing and listening capabilities and guide clinicians to select the most appropriate rehabilitation option.
Diagnostic OAE measurements provide invaluable information in the assessment and diagnosis of:
- Patients where behavioral testing is difficult
- Non-organic hearing loss (malingering)
- Noise-induced hearing loss
- Auditory neuropathy spectrum disorder (ANSD)
- Other cochlear vs retrocochlear disorders (site of lesion determination)
- Ototoxic medication effects
In diagnostic OAE testing, OAE results should not be analyzed as pass or refer, and protocols that are suitable for screening newborns, are generally not suitable for testing older children or adults.
OAE equipment
OAE equipment comes in many different shapes and sizes. It may function as a handheld only device, be driven only by the PC or may be capable to run in both modes.
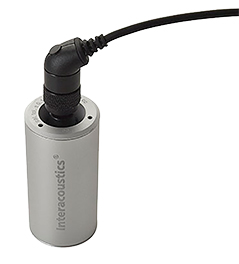
Hardware
OAE hardware always consists of a probe containing a microphone and speakers. The probe speakers generate the acoustic stimuli that are applied to the ear canal and the small microphone records the otoacoustic emission that is transferred back to the ear canal from the cochlea. The software or device firmware uses averaging techniques, algorithms, and filtering to extract the small outer hair cell response into something clinically useful that is displayed on the device or computer screen.
Of the entire OAE system, the probe receives the most wear and tear as it is often dropped and comes in contact with ears filled with cerumen or other debris. It is important that the probe is in good working order before testing patients.
Calibration
OAE equipment should be calibrated regularly, usually every 12 months. This ensures that accurate stimulus levels are being presented to the ear drum and that recorded OAEs correctly represent the pressure signal recorded from the ear canal.
Clinicians are rarely involved in the active calibration of OAE equipment but should check and be able to detect when a possible calibration error occurs.
Clinicians should check for:
- Bad connections between the probe and the hardware
- Problems related to debris or wax blocking the speaker or microphone ports in the probe tip
Conducting a daily real-ear check or probe integrity test will assist in detecting these errors.
In-ear stimulus calibration
Most, if not all OAE equipment performs some sort of in-ear calibration or adjustment of the stimulus level before starting the OAE recording.
The level of the stimulus delivered to the ear canal and measured by the probe microphone is used to adjust the stimulus presentation level by way of correction factors to accommodate for varying ear canal volumes.
Smaller ear canals (in infants) require a smaller stimulus output level at the probe end compared to adults in order for the same stimulus level to be received at the eardrum.
System distortion
A hardware malfunction can cause a distortion that masquerades as a biological response and can lead to result misinterpretation. System distortion usually occurs from a malfunctioning probe speaker or other hardware component.
It is simple to quantify the level of system distortion for each individual OAE system by conducting an OAE test in a valid cavity or ear simulator.
The results from a cavity test will show the noise floor of the instrument. Like all OAE measurements, it should be performed in a quiet environment to reach the instrument’s noise floor. This will enable the cavity test to show any potential erroneous signals that could be interpreted as OAEs. Ideally, there will be no such false OAEs above the noise floor.
In the case where OAEs are observed, check the probe for debris or wax or consult a service technician.
Daily system check
You should perform a daily check of your OAE equipment to ensure it is in good working order before testing on patients. Many clinics or screening programs have their own protocols for this including real-ear checks and probe cavity tests which they conduct at the beginning of each working day.
By conducting a daily real-ear test or probe integrity test, you can be certain that the results obtained throughout the day are valid.
As the probe and probe tip often come into contact with wax or other debris in the ear canal, a common fault affecting testing can be a blocked or obstructed probe tip. Regular cleaning of the probe tip is recommended to reduce the chance of wax or other debris making its way down the probe tip and into the probe body.
Probe integrity test
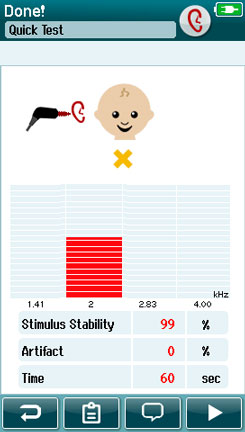
The probe integrity test ensures artifact responses (system distortions) are not being generated by the probe or hardware. Inspect the probe tip for wax or debris before conducting the test.
Test procedure
- Insert the probe into the provided test cavity or ear simulator. It’s important to use the correct-sized cavity for valid test results. Depending on the test cavity, you may need to attach an ear tip to the probe tip first.
- Select an OAE test protocol. As system distortion is dependent on the stimulus output level, select a protocol that reflects those used in clinical practice.
- Start the test and allow it to run until the test stops automatically. Do not stop the test manually.
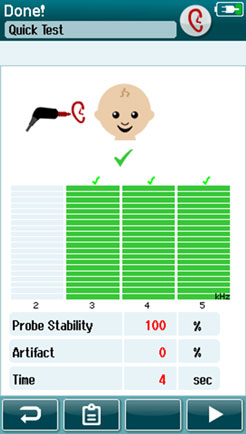
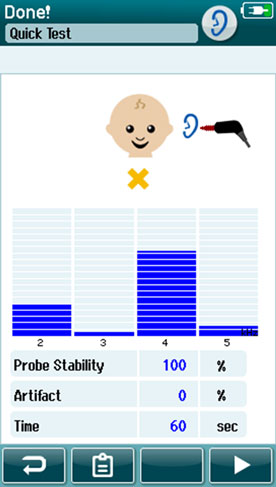
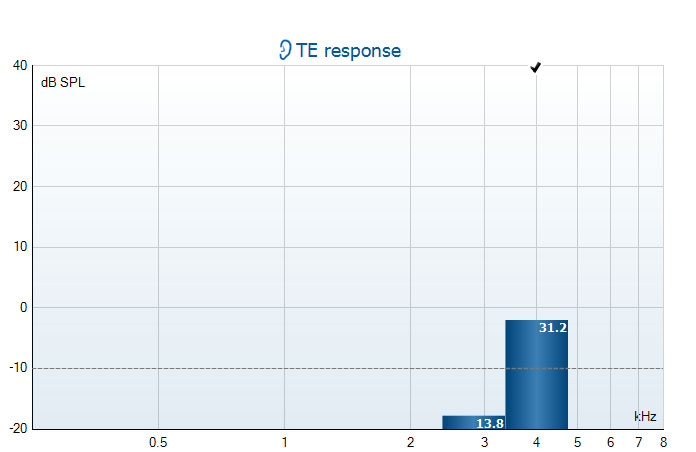
Test results
If the probe is functioning as it should, none of the frequency bands or points should have a checkmark, i.e. no artifacts/OAEs should be detected above the noise floor.
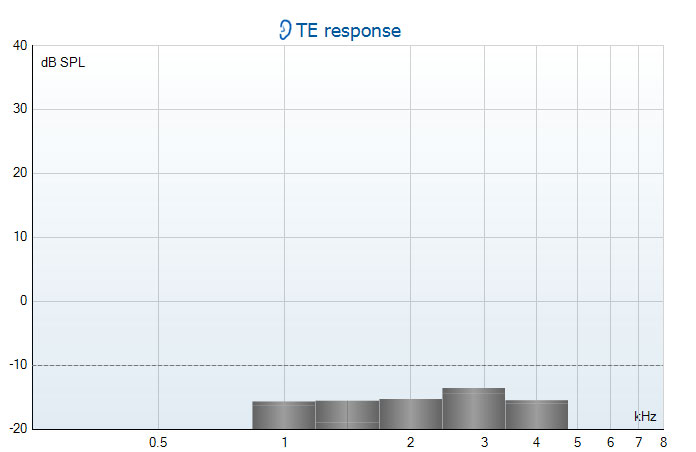
If an error message appears during testing or if one or more of the OAE bands or points has a checkmark (meaning detected), the probe integrity test has failed. This could indicate that:
- There is wax or debris in the probe tip and cleaning is required
- The probe was not placed in the test cavity or ear simulator correctly
- You need to check the probe’s calibration
Check and clean the probe tip and retry the test. If the probe test fails a second time, you should not use the probe to test on patients. Contact your local service technician for help.
Real-ear check
You can do this test by placing the probe in your own ear and running a common test protocol. If the OAE results do not match your expected OAE results, this could be a sign that:
- The probe is not connected correctly to the device
- The ear tip is not attached correctly to the probe tip
- There is wax or debris in the probe tip and cleaning is required
- The environment is too noisy for testing
- The probe was not placed correctly in the ear canal
- You need to check the probe’s calibration
Pre-test examinations and instructions
As the status of the outer and middle ear can affect OAE recordings, it is recommended to conduct the following tests before OAE testing.
1. Otoscopy
You should perform otoscopy to inspect the ear canal for wax/cerumen or other debris, or for any anatomical abnormalities. You should inspect the ear drum for a possible perforation. The outer ear is where the recording of OAEs begins and ends, so it is important to be aware of any pathologic or non-pathologic conditions that may affect testing.
2. Impedance measurements
Impedance measurements such as tympanometry, wideband tympanometry and acoustic reflex measurements will assist in providing information about the status of the middle ear. A middle ear disorder including slight negative middle ear pressure can significantly reduce or obliterate OAE responses.
Testing patients with PE tubes
There are no contraindications to measuring OAEs in patients with PE tubes. OAE measurements in patients with patent or unoccluded PE tubes typically show a reduced amplitude, especially at the lower frequencies.
Normal OAE amplitudes in ears with PE tubes provide evidence that the PE tube is patent (unoccluded) and has been effective in the resolution of a middle ear effusion, there is no significant middle ear dysfunction, and that outer hair cell dysfunction is absent.
The main difficulty in measuring OAEs in patients with PE tubes relates to equipment probe check/probe fit algorithms that cannot begin testing when excessively large ear canal volumes are detected. Some equipment allows the user to override the in-ear detector and proceed to testing.
Patient instructions
Ensure the patient is comfortable and not chewing or sucking on anything during the test. An example of a patient instruction could be:
“I am going to place a probe in your ear. The probe will play a loud sound and record a response from your ear. It’s important that you are quiet during the test which can last up to 1 minute.”
Selecting the right test protocol and settings
Otoacoustic emissions devices typically include a range of default test protocols for screening and/or diagnostics. However, it is the clinician’s responsibility to select or create the most appropriate test protocol for the given patient.
Unfortunately, there is not one test protocol that fits all, and sometimes a standard protocol may need adjustment for an individual patient. It is therefore important that the clinician understands the rationale for certain parameter settings and how changing certain parameters might affect the test results.
TEOAE or DPOAE?
There are many reasons for choosing one OAE test method over the other.
Some prefer the TEOAE methodology when trying to conduct a quick OAE screening on a child while others find DPOAEs more suitable when assessing adult patients.
Either way, both methodologies assess outer hair cell function and provide important information about the status of the cochlea.
Both TE and DP methodologies are good at measuring OAEs between 1.5 to 4 kHz. And both are somewhat poorer at measuring at 500 Hz, due to difficulties in separating the noise from the OAE response during averaging.
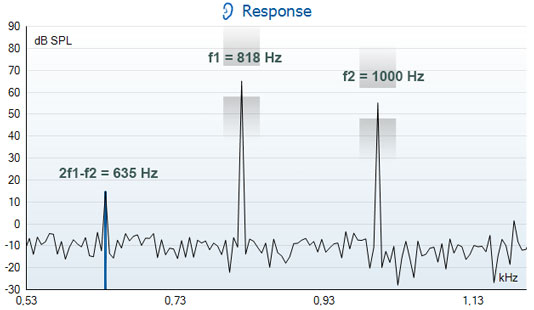
TEOAEs are better for recording at 1000 Hz when compared to DPOAEs due to the recording method. Looking at the example below, when we measure 1000 Hz in TEOAE, the ½ octave bandwidth spanning the center frequency (of 1000 Hz) extends from 840 to 1189 Hz. Whereas, in DPOAE, if the f2 is 1000 Hz, then that makes the f1 818 Hz, and so the frequency at which we are analyzing is 635 Hz (2f1-f2).
At this frequency, due to the typical frequency spectrum of patient and environmental noise, it is more difficult to achieve a satisfactory observation of the DPOAE signal above the noise level.
Conversely, it is more difficult to measure TEOAEs at frequencies higher than 4 kHz. This is due to the short travel times for the high frequency signals since they are processed at the basal end of the cochlea close to the oval window.
Typically at around 5 kHz, the TEOAE response arrives back at the probe after just 2.5 ms. Since the TEOAE response is about 1000 times smaller than the click stimulus, it is difficult to safely observe such a small signal so close to the large decaying stimulus pulse.
A screening or a diagnostic test protocol?
The choice of protocol very much depends on the purpose of the test and what information the clinician hopes to gain from obtaining the measurement.
Screening protocols that provide a pass or refer result are excellent when testing infants in a newborn hearing screening setting but would not be applicable for use on an adult patient undergoing ototoxic drug monitoring. It is the clinician’s responsibility to choose the most appropriate test protocol for each patient.
Should you repeat OAE tests?
Many audiological tests are repeated to provide certainty of the result. Clinicians may not even realize that they do this when performing audiometry. The well-accepted Hughson-Westlake stimulus presentation technique of down 10 up 5 dB for obtaining audiometric thresholds requires the clinician to accept the patient’s threshold after two confirmations at the same level have been provided.
It is also standard practice when performing ABR testing to reproduce the waveform at certain intensities close to threshold to ensure valid interpretation and determination of thresholds.
Repeating the OAE test is good practice and provides assurance to the clinician that the response shown on the screen is true and valid. While repeat testing takes extra time, it provides certainty when analyzing OAE measurements.
You can use an overlay function, if available, to show repeatability of the OAE response.
Test result display: Basic, advanced or FFT view?
If you can display results in various formats, select the most appropriate one for the type of test you are performing. Some software allows users to select between a more basic or advanced view of test results.
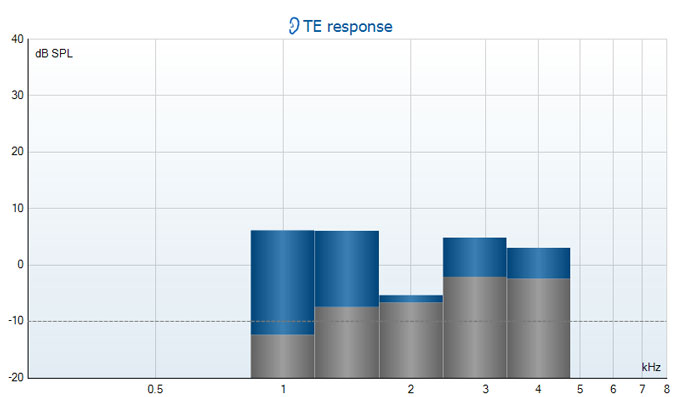
A basic display is typically used in screening programs to ensure testers/screeners do not over-interpret pass or refer test results. Bars may represent either the presence of absence of a response, but do not show absolute OAE amplitude levels or noise levels.
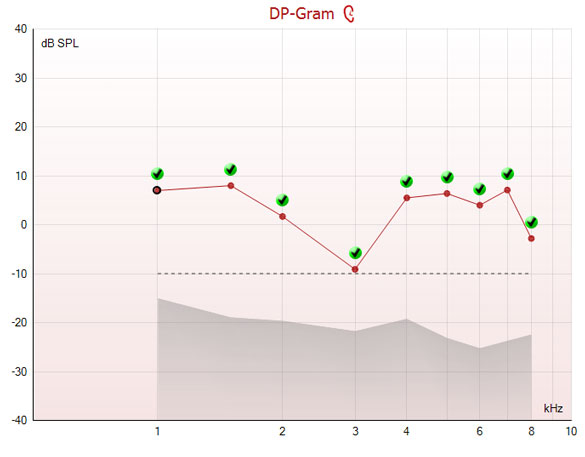
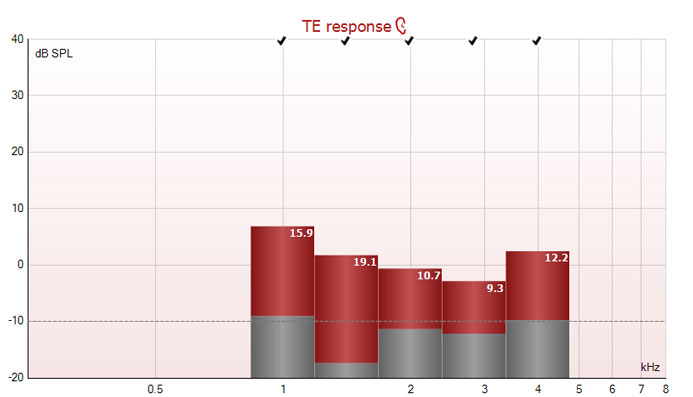
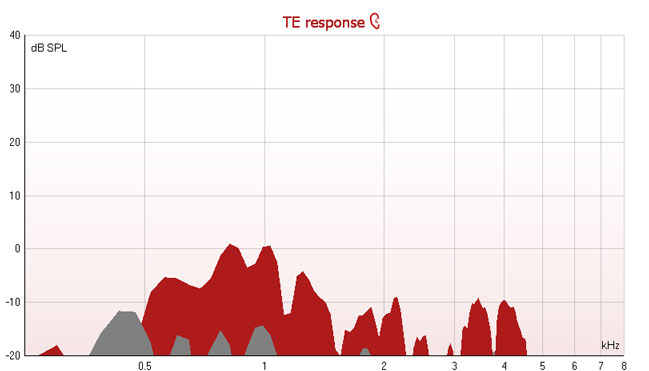
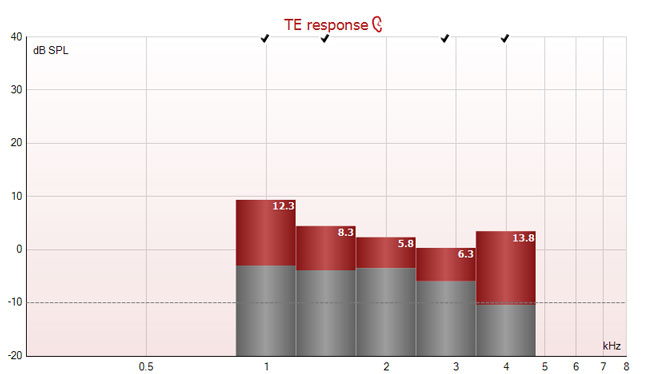
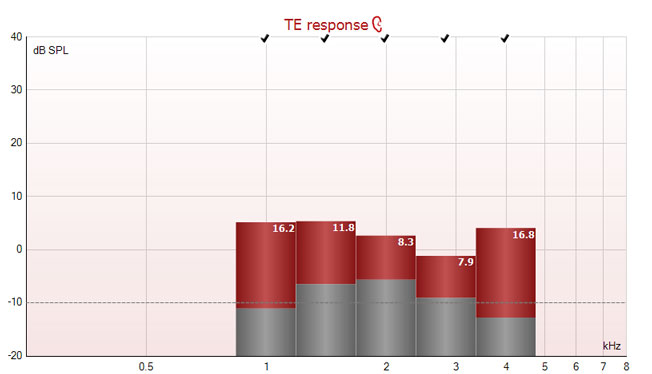
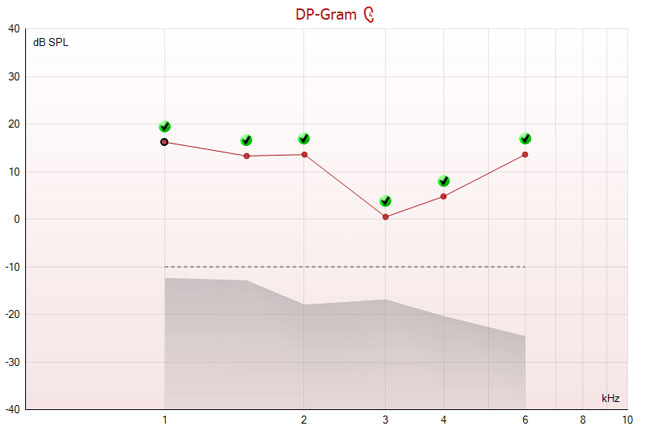
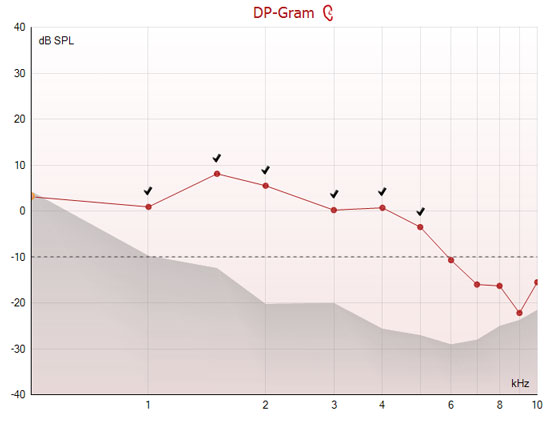
Advanced measurement displays usually show both the absolute OAE response amplitude and the noise for each DP point or TE band and provide the user with more information for interpretation.
Some diagnostic test equipment can display an FFT view of the results which can be useful for observing the fine structure present in the response.
Stimulus and probe check graphs
Where possible, stimulus and probe check graphs should be displayed. These are particularly useful for ensuring a good probe fit before starting the OAE test and for troubleshooting unexpected test results due to poor probe fit or stimulus ringing (in the case of TEOAE).
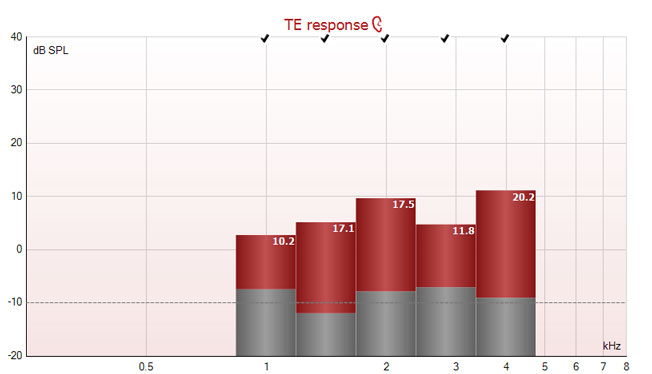
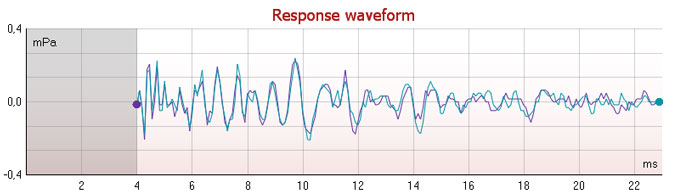
TE response waveform
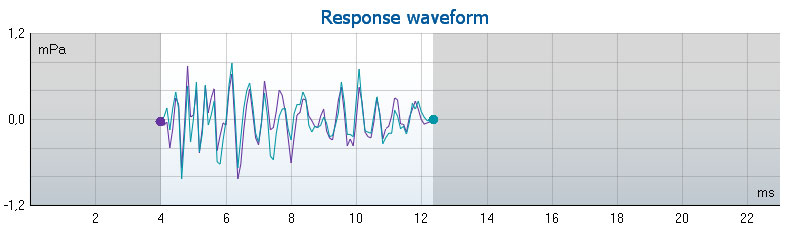
The response waveform graph displays the TEOAE response in the time domain (as a function of magnitude (mPa) over time (ms)). It shows the response as two superimposed averaged waveforms from the A and B buffers. The waveform reproducibility percentage is derived from the correlation between these two superimposed waveforms.
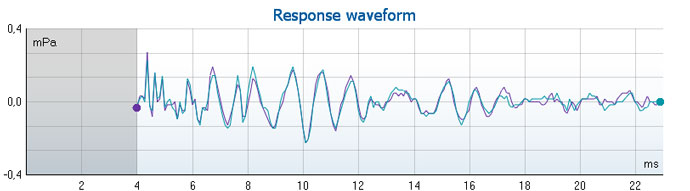
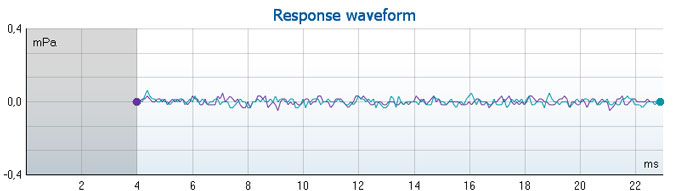
Clinicians will typically analyze TEOAEs in the frequency domain, but visualization of the response waveform can be helpful in detecting artifact responses.
These kinds of errors can manifest as a response which contains only residual ringing from the probe stimulus and appears in the first millisecond or two of the response.
Or perhaps tonal environmental noise (such as whistling), which happens to coincidentally be correlated between the two buffers.
This has the potential to result in one of the half octave bands indicating a valid OAE signal.
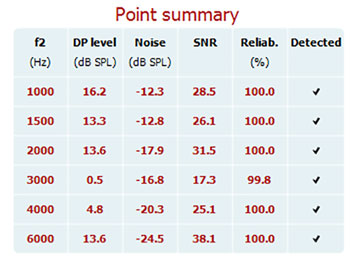
Test summary information
Most software will display some kind of numerical test information such as tested frequencies, SNRs, noise levels and more. This information will be important when interpreting the results.
Test frequencies or points
Select or create an appropriate test protocol that includes the cochlear region of interest.
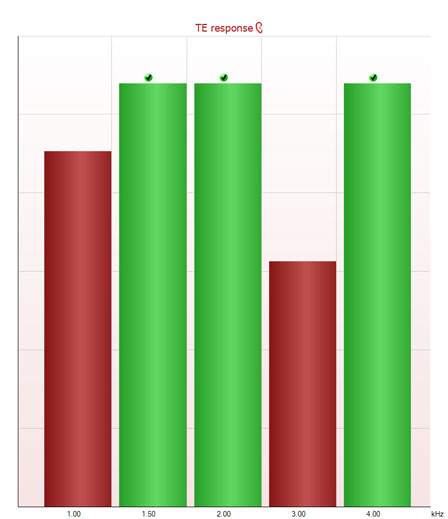
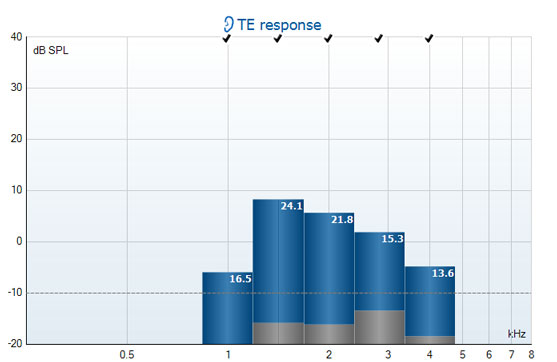
For TEOAEs, half octave bands centered around the major audiometric test frequencies are typically used – 1000, 1500, 2000, 3000, and 4000 Hz. Clinicians may also want to test other bands outside this range or view the FFT (Fast Fourier Transform) result graph for a more detailed information.
For DPOAEs, audiometric frequencies between 1 – 10 kHz are typically tested. The test frequency is normally denoted by f2 or the second primary tone.
Numerous inter-octave frequencies may also be recorded in cases of ototoxicity monitoring or tinnitus assessment.
Recording window (TEOAE)
The recording window range defines the time range from which the OAE is analyzed following the presentation of each click stimulus.
Most equipment will have a minimum start time somewhere between 2 to 4 ms. This ensures that any analysis of the OAE is not performed during presentation of the stimulus or the potential artifact that follows.
A short recording window of approximately 8 to 12 ms allows for more rapid presentation of the click stimulus meaning faster acquisition of OAE data.
The benefits of a short recording window are a:
- Faster reduction of the noise in the final averaged response
- Shorter test time to achieve the required signal to noise
- Greater signal-to-noise ratio in the same amount of time as a test using a longer recording window
Using a shorter recording window results in a reduction of the lower frequency part of the response and should not be used when trying to record TEOAEs below 1000 Hz.
A longer recording window of approximately 20 ms should be used when trying to assess the broadest range of cochlear hair cell function. Stimulus presentation becomes slower meaning slightly longer test times to collect the same number of sweeps when compared to using a short recording window. You should always select a long window when assessing TEOAEs below 1000 Hz.
Linear vs non-linear clicks
Screening and diagnostic TEOAE testing is typically conducted using a non-linear click. Be careful when selecting a linear click stimulus as it has more chance of producing artifact responses. When using a linear stimulus, stimulus levels do not usually exceed 70 to 75 dB SPL. This is much lower than the typical 80 to 84 dB SPL used with a non- linear click stimulus.
TEOAE stimulus levels
TEOAE non-linear click stimulus levels are normally set in the range of 80 to 84 dB SPL. For a linear click, stimulus levels do not usually exceed 70 to 75 dB SPL.
DPOAE stimulus levels
Two different stimulus levels, labeled as L1 and L2, need to be defined when performing DPOAE assessments. The L1 is the stimulus level of the first primary tone (f1), while L2 defines the stimulus level of the second primary tone (f2). Selecting the most appropriate stimulus levels for each primary is critical to record a valid DPOAE.
Detection of abnormal DPOAEs is more likely when using a lower stimulus level such as 55 dB SPL compared to 75 dB SPL. Typical protocols use a 65/55 dB SPL relationship.
The possible intensity relationships between L1 and L2 are:
1. L1 < L2
This relationship produces suboptimal DPOAE responses and is rarely used in clinical practice.
2. L1 = L2
Consistently robust DPOAEs can be recorded with this relationship and have been used in many early investigations and clinically until the mid-90s. Using an L2 level that is equal or only a little less than L1 is appropriate when using higher levels of stimuli (around 75 dB SPL).
3. L1 > L2
This stimulus intensity relationship consistently produces robust DPOAEs and has two main advantages over the L1 = L2 relationship. Firstly, DPOAE amplitudes are typically 3 dB larger and secondly, there is enhanced DPOAE sensitivity to a variety of cochlear dysfunctions.
f2/f1 ratio (DPOAE)
The ratio of f2/f1 sets the ratio relationship between the two stimulus frequencies. The frequency relationship is critical to evoking a DPOAE response. If the two tones are spaced too far apart or too close together, a DPOAE will not be recorded.
Evidence suggests that the most clinically effective f2/f1 ratio for testing patients across all age groups is between 1.20 and 1.23.
The DPOAE is largest when the ratio of f1 to f2 is 1.22.
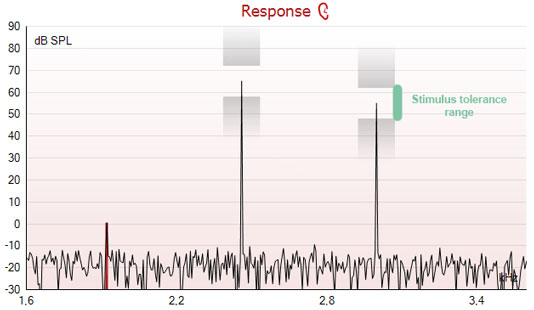
Stimulus tolerance
Accurate presentation of the stimulus to the ear is important to produce valid OAEs. A stimulus tolerance value (dB) defines the allowed difference of the stimulus presentation level in both a positive and negative direction.
When the stimulus tolerance is exceeded, either a warning will be given, or testing will be stopped. For example, if the TEOAE stimulus level was set at 80 dB SPL with a stimulus tolerance of 3 dB, then a warning would appear, or the test would be stopped if the stimulus fell to 77 dB SPL or reached 83 dB SPL.
Changes in stimulus levels during testing usually occur due to probe movement in the ear canal. You can reduce probe movement by ensuring a secure probe fit before testing and instructing the patient to remain still during testing.
Filtering (TEOAE)
Applying a high pass filter assists in the collection of data during noisy conditions, helping to remove low frequency noise. Be careful when using filtering as it not only filters out the noise, but the OAE response as well.
Example: Setting the high pass filter to 1200 Hz will attenuate not only the noise below this frequency, but also the OAE response. This may produce a reduction in OAE amplitude below 1200 Hz (e.g., in the 1000 Hz band).
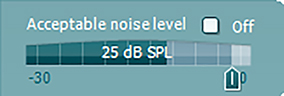
Noise rejection level
As ambient and physiologic (patient) noise levels have a huge effect on OAE recordings, assessing the noise levels in the test environment before and during testing is important, especially in non-ideal test environments such as in a newborn nursery.
Most OAE software displays information about ambient noise levels recorded by the probe microphone and only allow testing to continue if noise levels are below acceptable levels:
- In TEOAE testing, a typical noise rejection setting is 55 dB SPL
- In DPOAE testing, a typical noise rejection setting is 30 dB SPL
If noise levels surpass the noise rejection level, sweeps are rejected and are not included in the average. Using an appropriate noise rejection level ensures results are not contaminated by excessive noise.
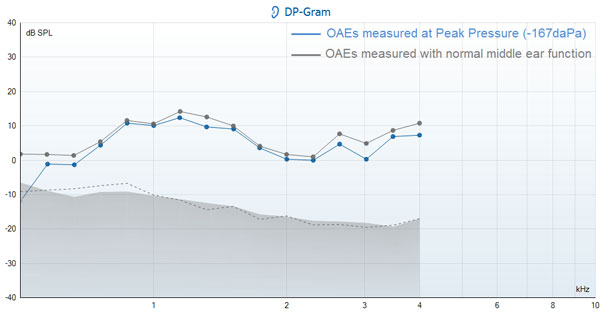
Measuring at ambient or tympanic peak pressure (pressurized OAE)
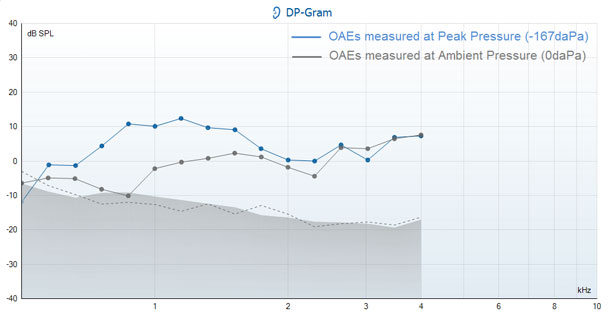
Published research shows that negative middle ear pressure has the effect of decreasing OAE amplitude levels making it difficult to assess cochlear outer hair cell function.
Measuring OAEs at ambient pressure or O daPa means that the middle ear status is not taken into consideration during the recording.
Conversely, measuring at tympanic peak pressure, compensates for any negative or positive middle ear pressure, by equalizing the pressure on both sides of the tympanic membrane, and in effect improving detection. This same principle has been used for many years when recording acoustic reflex measurements.
Perform a pressurized OAE test by first conducting a tympanometry measurement to get the tympanometric peak pressure value (e.g., –167 daPa).
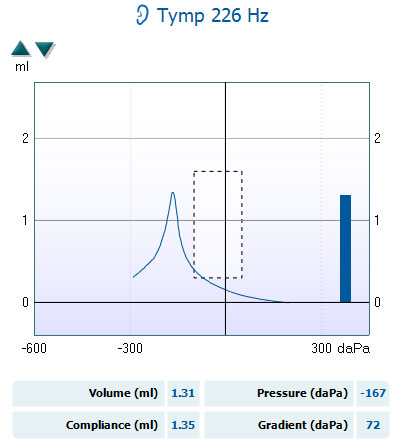
The OAE measurement is then conducted while the probe maintains the same pressure in the ear canal. As the pump needs to maintain a stable pressure over a long period of time for an OAE test, compared with a quick tympanometry test, it is important to ensure a good, tight probe fit before starting.
This will ensure that the pressure remains consistent and accurate throughout the test and ensure optimal test results. The aim of pressurized OAE testing is to be able to make a conclusion about outer hair cell status even in the presence of a negative middle ear disorder.
OAE detection/stopping criteria
The presence or absence of an OAE response is determined by a combination of mathematical algorithms, averaging techniques and stopping/detection criteria.
Advanced averaging techniques such as Bayesian weighting can reduce test times when compared with traditional averaging techniques.
Various stopping criteria such as signal-to-noise ratio, minimum OAE level, and minimum numbers of sweeps are assessed before an OAE band or point are labeled as detected.
SNR
The SNR can be thought of as an estimate of the reliability with which the OAE response level has been estimated. When SNRs are high, the contribution of the noise in the recording is low and there is more certainty that the displayed OAE response is true.
The SNR is calculated from two variables – the OAE response (or signal) generated by the cochlea and the noise, a random variable unrelated to cochlear status. The signal (OAE response) should remain constant during averaging, while the noise level should decrease as test time increases.
Most literature recommends a minimum SNR of 6 dB in addition to other criteria to determine the presence of a valid OAE response. Manufacturers may also provide equipment specific recommendations based on sensitivity studies.
Consulting the relevant user manual should provide this information.
Residual noise
Residual noise is the remaining or left-over noise in the recording after continued averaging (data collection).
Some equipment allows the use of a residual noise value as a stopping criterion instead of absolute test time. Its benefit is that it can save unnecessary test time in cases where OAEs are absent.
For example, each specific OAE device has a hardware noise floor that averaged noise will never fall below. You can measure this by placing the probe in a test cavity and running a protocol lasting a few minutes.
If we knew that the device’s noise floor was -20 dB SPL, then if we averaged for long enough to reach the noise floor and no OAE response was detected, there would be no point in continuing to run the test. Another way to look at it is that the measurement at the specific frequency is considered to be so quiet that an OAE would have been detected if it were present.
Test time
Select a suitable test time to ensure that enough time can be spent to extract the OAE response from the surrounding noise in the recording.
For TEOAE testing, this can usually be set as either an absolute test time (e.g., 1 to 6 minutes) or as a maximum number of sweeps (e.g., 2000 sweeps). Testing normally continues until the maximum test time is reached or all TEOAE bands are detected, whichever happens sooner (unless of course, residual noise as a stopping criterion has been selected).
For DPOAE testing, an absolute test time (e.g., 1 to 6 minutes) can be set where testing of each DP frequency continues in loops until all DP frequencies are detected or the time runs out. Or, each DP frequency can be tested for a maximum specified length of time (e.g., 4 seconds) or until the DP frequency is detected, whichever comes first.
Minimum number of sweeps (TEOAE)
This setting defines the minimum number of sweeps that must be recorded before the test meets the detection criteria.
It is usually recommended to collect a minimum of 80 sweeps to ensure enough good data can be analyzed to form a conclusion.
Minimum total OAE
The total OAE value is the total energy level of the correlated A and B response waveforms. It is obtained from the overall FFT response, not just the half octave frequency bands of interest. In other words, it gives an indication of the amplitude of the total obtained OAE response.
Some newborn hearing screening protocols stipulate a minimum total OAE of 0 dB as part of the stop criteria.
Minimum OAE level
OAE amplitudes are generally in the range of -10 dB SPL to +30 dB SPL in healthy functioning ears. Therefore, setting a minimum OAE level ensures that low-level artifact responses are not accepted as a true OAE response.
Minimum OAE levels should not be set lower than device-specific system distortion levels.
DP tolerance
A DP tolerance level may be set to define how stable the OAE level must remain over time in order for it to meet the detection criteria of a true response. A strict DP tolerance value of ±2 dB will increase test times for each test frequency but will provide further certainty that it is a valid OAE response.
DP reliability
DP reliability is another criterion that you can use in conjunction with the SNR and DP tolerance settings to ensure certainty of the DP frequency response.
DPOAEs are traditionally interpreted as present when the difference between the OAE and the noise level is significant (SNR of 6 dB). Caution is needed for two reasons:
1. The noise level is an average level
While the OAE level is relatively stable, noise fluctuates. If fluctuations around the measured frequency are large, then a signal-to-noise ratio of 6 dB does not imply that the OAE appears significantly outside the noise spectrum. The OAE can actually be an accidental peak of the noise.
2. The criterion of a 6 dB SNR originates from newborn hearing screening
Test protocols in this arena require high sensitivity values of around 99.9%. As more than one frequency, usually 3 out of 4, is required for a pass, a 6 dB SNR at 3 of the 4 frequencies provides certainty that the pass result reflects the measurement of real OAEs. As the number of frequencies required for a pass is reduced (to let’s say 2 out of 4), a greater SNR for the remaining frequencies is required to maintain a test sensitivity of 99.9%.
In other words, when evaluating each frequency individually, as required in diagnostic evaluations, a simple 6 dB SNR cutoff may not be reliable enough to be certain that the DP point reflects a true OAE response from the cochlea. So, by using a reliability setting of 99.9%, the clinician can be certain that there is less than 0.1% chance that the detected OAE is part of the noise.
Using the reliability instead of (or in addition to) the signal-to-noise ratio gives more confidence in the OAE result. The time spent on the measurement will typically not increase. In those few cases where longer measurement times are needed, it allows you to make a diagnostic conclusion that you can trust.
Number of bands/points for a pass
Screening protocols typically use criteria of 2 or 3 out of 4 bands or points for a pass result.
Mandatory bands/test points
A mandatory band or point can be set for inclusion in screening protocols. For example, if you used a 2 out of 4 bands for a pass protocol, you may set 1000 Hz as a mandatory band for inclusion. Therefore, if during testing, 2000 and 4000 Hz were detected, testing would continue until 1000 Hz was detected or the test timed out.
Before and during OAE testing
This section will describe important things to consider before and during OAE testing.
Ear tip selection
The ear tip is attached to the probe tip and holds the probe in the ear. The selected ear tip should be large enough to fill the ear canal, but small enough to allow for a deep insertion. Various sizes are available to suit infants, adults and children and practice is the key for selecting the right size each time.
Probe placement
A good probe placement is essential for valid OAE measurements. Incorrect probe placement can lead to excessive noise in the recording or incorrect stimulus level presentation.
You can achieve a good probe placement by first straightening the ear canal before insertion. For adults, you can do this by pulling the pinna of the external ear upwards and out (away from the head). For infants and younger children, pull the pinna downwards and out.
A deep probe insertion will help to reduce the effects of ambient noise in the OAE recording.
Never hold the probe or probe cable during testing as this may increase noise levels during measurement.
The clinician should periodically check that the probe placement has remained stable during testing.
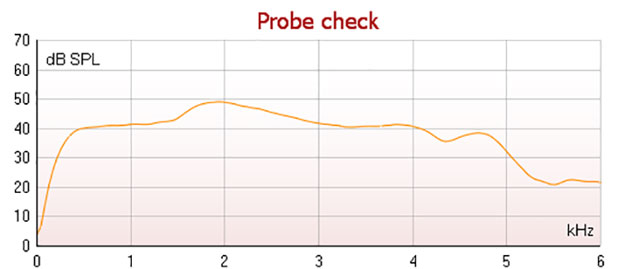
Probe fit/check graph
The probe check graph or in-ear detection indicator provides visual feedback about the quality of the probe fit in the ear. The probe fit is usually assessed using a broadband stimulus such as a click and the corresponding probe check graph can help to show a leak or a blocked probe.
A good probe placement has been achieved when the probe check graph shows a relatively flat response curve over a wide frequency area.
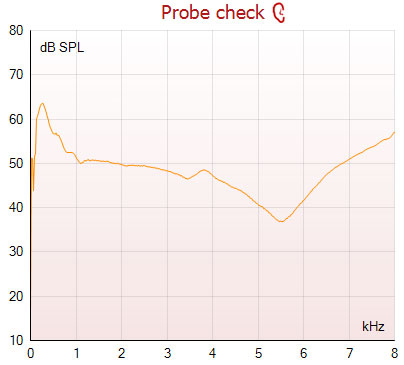
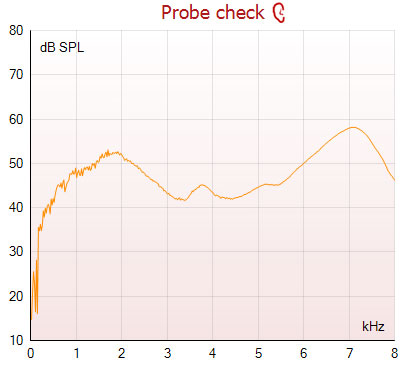
Some systems provide a correlation percentage of the probe fit from the beginning and the end of the test. This provides a good sign of probe placement during the entire test.
Check the probe fit/check graph for any sign of probe movement in the ear canal during the test.
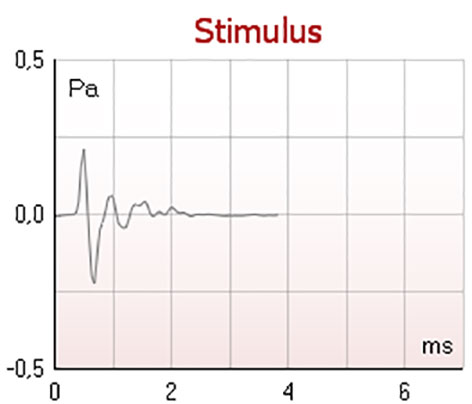
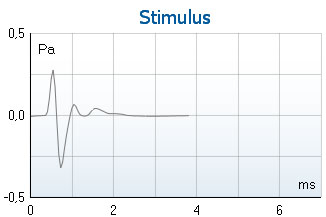
Stimulus graph
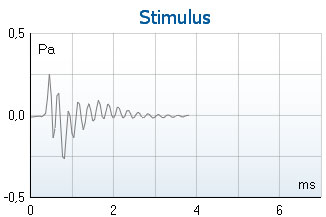
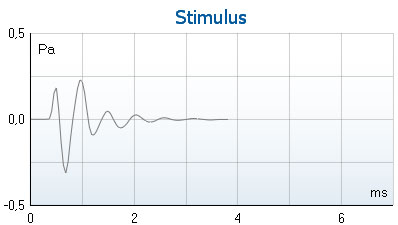
Before TEOAE measurements, check the morphology (shape) of the click stimulus to ensure that the stimulus level that will be delivered to the ear canal is correct and that there is very little ringing.
If the stimulus does not look like it should, try removing and re-inserting the probe in the ear canal to get a better placement.
Monitor the stimulus graph for any sign of probe movement in the ear canal during the test.
Stimulus tolerance/stability
The stimulus intensity is monitored during testing and most devices provide some kind of visual feedback or warning when stimulus tolerances are exceeded. The main reason for stimulus levels to exceed the set tolerance is due to the probe moving in the ear canal or falling out during testing. It is recommended to stop the test in these circumstances, remove and replace the probe ensuring a better fit, and then start a new test.
Acceptable noise level (noise rejection)
Monitor the noise levels before and during testing. You may need to pause or stop testing to troubleshoot and correct the problem before continuing with testing.
If noise conditions change throughout the test, the most likely causes are:
1. An increase in ambient background noise
Find out what has changed in the test environment. Move to a quieter location for testing if needed or wait until intermittent noises have stopped.
2. The patient is making noise
Re-instruct the patient to remain still and quiet during the test (no sucking, chewing, heavy breathing, coughing and so on).
3. Poor probe placement
Check that the probe is securely fitted in the ear canal.
Analysis and interpretation of the results
Analysis of OAE test results differs depending on whether you performed testing for screening or diagnostic purposes.
Analysis of screening OAE results
In screening, results are usually displayed as a PASS or REFER. In some devices, the result may show as INCOMPLETE.
PASS
Protocols used in screening typically require 2 or 3 out of 4 OAE bands or points to be detected for the result to state a pass.
When the test is labelled as PASS, this means that 2 or 3 out of the 4 test bands (protocol dependent) have been detected. In newborn hearing screening, this would indicate that there is a very low probability of the infant having a significant auditory disorder that will interfere with communication. It would generally rule out a moderate, severe, or profound hearing impairment, but cannot detect disorders such as Auditory Neuropathy Spectrum Disorder (ANSD).
REFER
A REFER on a screening test only indicates that the detection criteria of the test protocol was not met. This could be due to the following reasons:
- The test environment was too noisy for testing
- The patient was too noisy during the test (sucking, crying, moving)
- The patient has a hearing loss (conductive or sensory)
- The patient has fluid in the ear canal or middle ear
- Equipment failure
- Inexperienced tester
Unfortunately, it is impossible to know the reason and therefore we cannot interpret or extrapolate anything from a refer result.
In newborn hearing screening, infants that REFER on an OAE test are usually rescreened using OAE or automated ABR testing before being referred to a diagnostic audiology department for more thorough testing to rule out a permanent hearing loss.
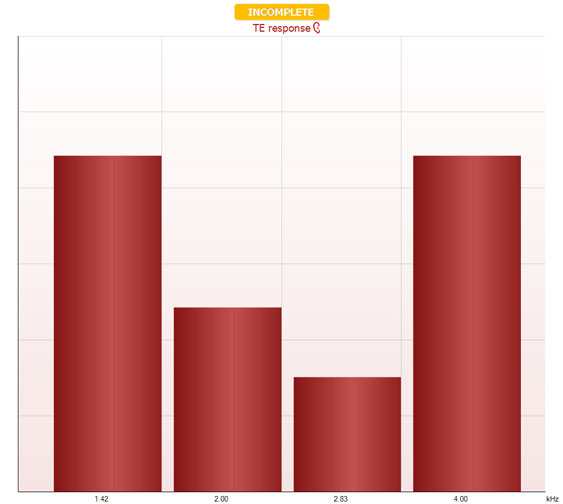
INCOMPLETE
Some devices show an INCOMPLETE result if you stop the test manually during testing. An incomplete test label only tells us that the test was stopped for some reason (e.g., infant woke up during testing, technical issue). With incomplete results, we cannot determine whether the test would have passed or referred. You should repeat testing in this instance.
Analysis in diagnostic assessments
When you measure OAEs as part of the test battery approach, you should analyze and interpret the results as more than a simple pass or refer. Diagnostic test protocols typically test more than 4-5 test frequencies and there are many factors to take into consideration when making an interpretation.
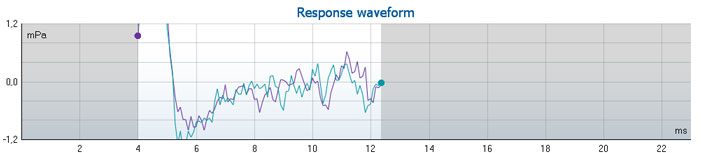
1. Stimulus graph (TEOAE)
If a good probe fit was obtained and maintained throughout the test, the stimulus graph displays a click stimulus like the one below. If the final stimulus graph does not show an expected click morphology, you should view the results with caution. Repeating the TEOAE test with a better probe fit is recommended to rule out any stimulus effects on test results.
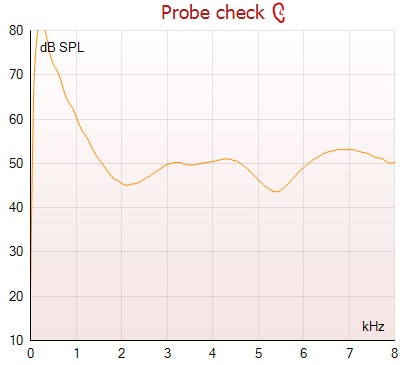
2. Probe check graph
View the probe check graph and any correlation values to get an overview of how well the probe was placed and remained in the ear during testing. A high correlation percentage indicates that the probe barely moved during the test. A low correlation percentage indicates significant movement during testing and results should be viewed with caution. Repeating the test is recommended in these cases.
3. Noise floor
When analyzing OAE test results, noise in the recording can significantly affect the presence or absence of a detected OAE. It would be detrimental to the patient’s diagnosis to indicate absent OAEs simply because of a high noise floor
Therefore, the first step in analysis is to check that the noise floor was significantly low. If a high noise floor is present, it may be necessary to retest the patient to get an accurate result.
A goal in OAE testing is to get noise floors as low as the system noise. This ensures that if an OAE was present, it would have been detected.
4. Minimum OAE level
OAEs typically have an absolute amplitude of -10 dB SPL or higher. You should analyze OAEs appearing below this level with caution, as they may be a system distortion or artifact. Different devices have different levels of system distortion and therefore each device may use a different minimum level to that above. Check the manufacturer’s specifications or run your own system distortion check when obtaining a new device.
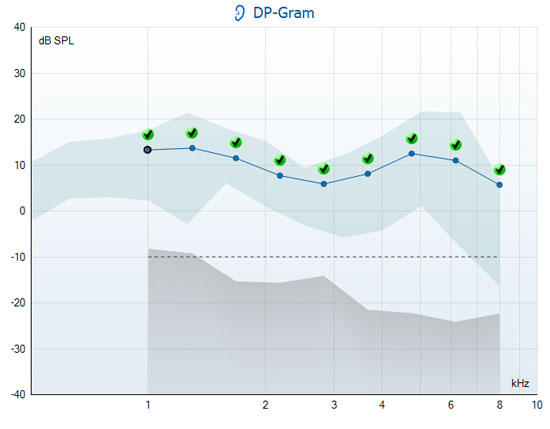
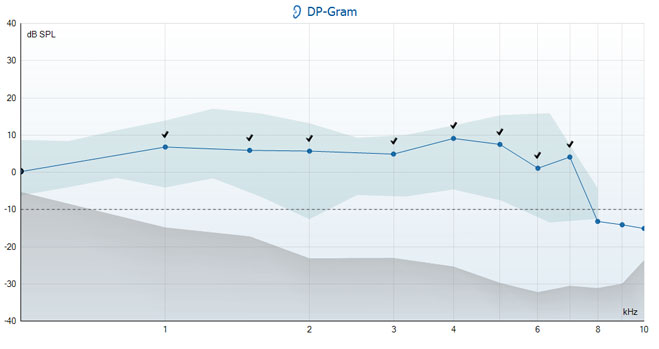
5. Normative data
Normative data characterizes what is usual or normal for a given population. Therefore, normative OAE data can be very useful in determining whether or not the patient’s OAEs are normal compared to their peers and can assist in categorizing OAEs as either present and normal, present but abnormal, or not present/absent.
As OAE systems differ in noise floors and sometimes in the calculation of the OAE response level, it is important to use normative data that was collected from the device being used for testing. The test population used to collect the normative data should also match the patient being tested. It would be unwise to use infant normative data when analyzing adult OAE measurements.
6. Response (waveform) reproducibility
The response (or waveform) reproducibility is expressed as a percentage and refers to the cross-correlation between the A and B response waveforms. The closer the value is to 100%, the more highly correlated or similar the A and B waveforms are, indicating highly reproducible OAE responses in each buffer (A and B).
Historically, it was used in TEOAE measurements to decide whether an OAE was present or not by visual assessment of the OAE waveforms. Waveform correlation proved to be a useful numerical metric to assist in this OAE waveform identification process.
However, once OAE equipment contained processors with enough power, the OAE waveform method of identification was replaced by frequency analysis typically resulting in aggregating of the spectral power into half octave bands.
This has the advantage of yielding clinically useful frequency specific information about the TEOAE and can often result in the satisfactory observation of a TEOAE at several frequency bands despite the presence of too much noise in other frequency bands.
Current protocols use a stop criterion based upon signal-to-noise ratios of the selected frequency bands. In contrast, waveform reproducibility can be thought of as the signa-to-noise ratio of all the frequency bands, as well as including any frequencies that are outside of the frequency bands of interest.
This fundamental difference often becomes important in the case of neonatal screening using TEOAE. Typically, the noise present in the neonatal screening test environment is dominated by low frequencies (below 1 kHz). These emanate from nearby equipment, conversations down the corridor, probe cable movement, air-conditioning and similar.
Because the waveform reproducibility is affected by all the frequencies in the recording, there can often be a resulting poor level of reproducibility caused by the low frequencies that are in fact well below the OAE frequency bands of interest. In this situation, a stop criterion based on the signal-to-noise ratio of the frequency bands is far superior.
7. Stimulus stability (TEOAE)
Stimulus stability (displayed as a percentage) indicates the change between the stimulus level at the beginning of the measurement period and the subsequent level at a set point in time during the measurement.
A stimulus stability of 90% or greater indicates a change in stimulus level of less than 1 dB throughout testing. A stimulus stability of 79% indicates a change of approximately 2 dB in stimulus level and a stimulus stability of 59% indicates a change of approximately 3 dB in stimulus level during testing.
Low stimulus stability percentages most likely indicate probe movement in the ear canal during testing. In such cases, re-instructing the patient to remain still, re-obtaining a good probe fit, and running the test again is recommended to ensure that results are valid.
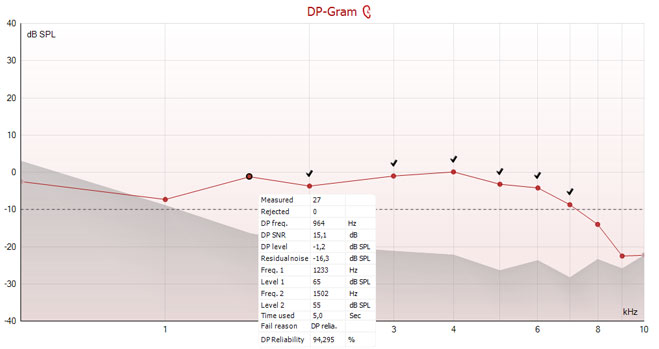
8. Reliability % (DPOAE)
The reliability percentage is available for each test frequency and provides an indication of how sure the detector is that the response displayed was generated by the cochlea. Only responses that meet the reliability percentage set in the protocol will be marked as detected by the software, even in cases where the SNR exceeds the minimum set value.
9. Total OAE (TEOAE)
The Total OAE value is the total energy level of the correlated A and B response waveforms. It is obtained from the overall FFT response, not just the half octave frequency bands of interest. In other words, it gives an indication of the amplitude of the total obtained OAE response.
10. A&B mean
The A&B mean is the sound pressure level of the average of the A and B waveforms.
11. A-B difference
The A-B difference is the RMS (Root Mean Squared) of the difference between the A and B waveforms and gives an indication of the residual noise in the recording.
When a high wave reproducibility percentage is calculated, a small A-B difference value is expected.
12. Categorizing OAEs
You should categorize OAEs into one of three categories in conjunction with normative data:
- Present and normal
- Present and abnormal
- Not present (absent)
Present and normal
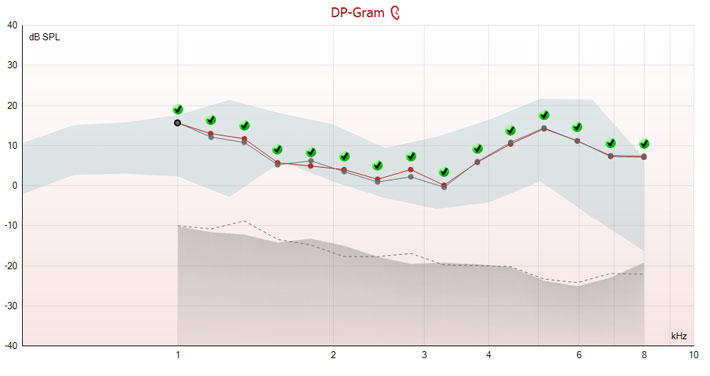
If the recorded OAE meets the SNR and other criteria for detection and OAE levels fall within the normal range, the individual band or test frequency would be categorized as present and normal.
Present and abnormal
If the recorded OAE meets the SNR and other criteria for detection, but falls outside the normal range, it should be categorized as present, but abnormal.
Not present (absent)
If the recorded OAE does not meet the SNR or other detection criteria, it should be categorized as not present (absent).
Further reading
Ramos JA, Kristensen SGB, Beck DL. An overview of OAEs and normative data for DPOAEs. Hearing Review. 2013;20(11):30-33.
Beck DL, Speidel D, Arrue Ramos J, Schmuck C. Otoacoustic Emissions and Pressurized OAEs. Hearing Review. 2016;23(7):30.
McCreery R. Building Blocks: Otoacoustic Emissions: Beyond ‘Pass’ and ‘Refer’. The Hearing Journal. 2013;66(9):14-16.
Kemp DT. Otoacoustic emissions, their origin in cochlear function, and use. British Medical Bulletin. 2002;63(1):223–241.
Glattke TJ, Kujawa SG. Otoacoustic Emissions. American Journal of Audiology. 1991;1(1):29-40.