
The Benefits of Weighted Averaging in Otoacoustic Emission (OAE) Measurements
Description
This paper discusses the mechanism of weighted averaging and in what circumstances it improves otoacoustic emission (OAE) measurements. It details investigations of OAE measurements on a wide range of test subjects and in the full range of conditions encountered in clinical situations.
It reveals that there are circumstances where weighted averaging conferred considerable reductions in test times, that it provides beneficial frequency-dependent improvements, and that no negative impacts could be shown.
Introduction and background
The measurement of small physiological signals in the presence of noise, at similar frequencies, has benefited in recent decades from the increasing power of digital signal processing methods. The fundamental process of repeating the measurement many times and summing the responses to derive an average response is the bedrock of these signal processing methods.
However, the noise amplitude is rarely constant and so the addition of a noise rejection technique based on the amplitude of the noise enhances the efficiency of data collection. Responses that contain a level of noise greater than the rejection threshold are not included in the summing process and thus do not contaminate the averaged response. This rejection of noisy responses results in a longer test time to achieve the required number of responses in the averaged response.
Choosing the best level for this noise rejection so that the measurement achieves the least contaminated averaged response as fast as possible can be complicated. These complications arise from the fact that the OAE signal is typically much less than even the lowest amplitude of noise present, and that typically there can be a range of noise amplitudes that vary by a factor of 10 during the course of the measurement.
Whilst researching the efficacy of novel algorithms to be employed in Interacoustics OAE instrumentation, large quantities of OAE recordings were undertaken in a wide variety of typical noise environments and with a range of test subjects from neonates to mature adults. All the real-time audio data from these measurements was saved to hard disk and each test was run for a full two minutes rather than stopping if an OAE response was detected.
This resource, which contains many hours of data recordings, has become an invaluable resource for evaluating and optimizing various OAE signal processing techniques. For example, it permits a very easy investigation into what impact changing the noise rejection level would have on the total test time of an OAE measurement, or what ‘quality’ of OAE measurement can be achieved in a fixed amount of test time.
We can explore each of these data recordings and study what noise level is present in each of the individual epochs (i.e. the approximately 15 milliseconds of data that follows each of the click stimuli used in a TEOAE measurement). For any given recording from an ear, we can then examine the distribution of the various noise levels in the recording to visualize the spread and relative quantity of each noise amplitude.
The graphs below show these noise distributions for a quiet neonate (Figure 1), a very quiet adult (Figure 2), and a noisy neonate (Figure 3).
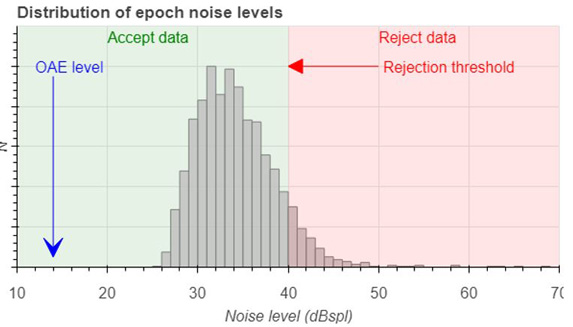
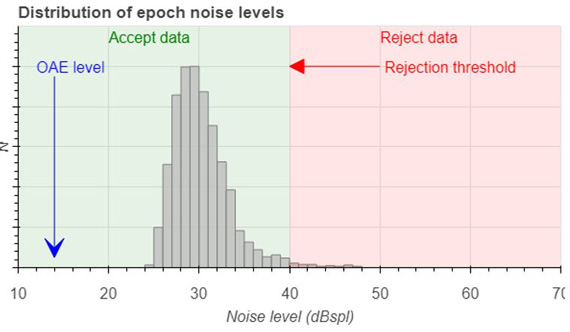
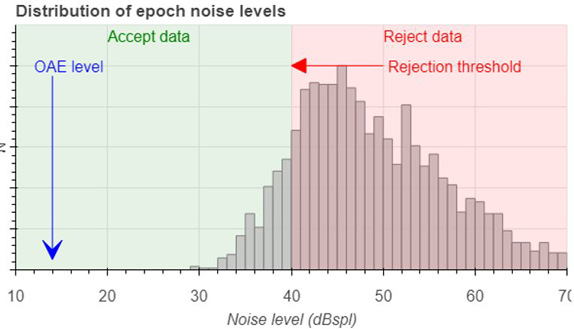
Each of these graphs shows a typical level of the noise rejection to show the relative quantity of epochs that will be accepted (shaded green) and rejected (shaded red) by employing a simple noise rejection scheme. The greater the difference between the OAE level and the noise amplitudes, the more data needs to be averaged to get a clear and identifiable response.
We can estimate the test time to get – for example – a 6 dB signal to noise ratio (SNR) using simple signal processing theory so long as we assume that the noise is random (i.e. Gaussian).
Using the levels shown in the above graphs, we can calculate that with a noise level of 35 dB SPL, an OAE of 14 dB SPL, and a rule of 6 dB SNR to observe the response, we need to get an average comprising the responses of approximately 500 repeated stimuli. This is equal to a little under 10 seconds of data collection.
It should be noted that an OAE of 14 dB SPL – whilst typical of a neonate – is larger than in a normal adult, and a constant noise level of 35 dB SPL or less can only be achieved with cooperative subjects in a quiet test environment.
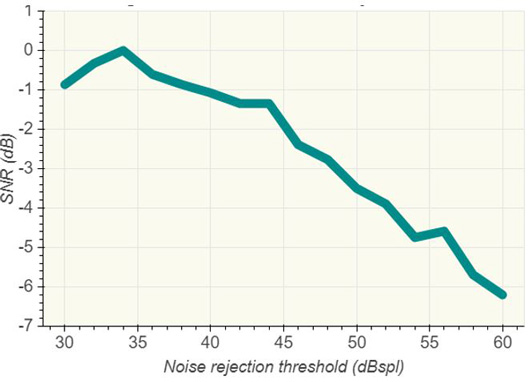
An examination of the effect of changing the noise rejection level for any given recording yields a curve which indicates the quality of the final averaged response versus the noise rejection level (Figure 4). It shows that there is an optimum rejection level for this particular recording.
However, the fact that this optimum is a function of the distribution of the noise (along with the OAE amplitude), means that this curve of performance against rejection threshold will be different in every single measurement recording.
For any given recording, if we set the rejection threshold too low, it takes a long time to get enough responses to overcome even the low levels of noise in the responses. If the threshold is too high, we allow too many noisy responses into the average and thus increase the contamination of the averaged response.
What is weighted averaging?
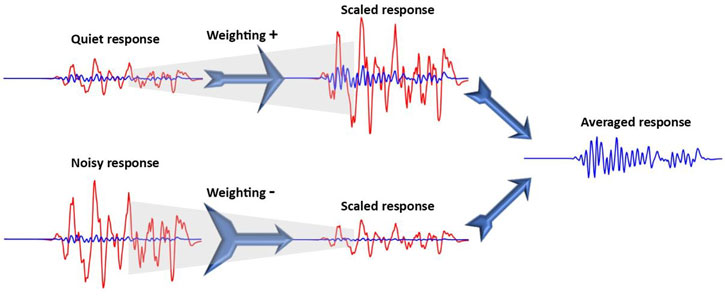
Weighted averaging is a method to increase the influence of the best quality individual responses in the final average. This is achieved by assessing each individual response to determine the quantity of noise and then applying a scaling factor to this response before it is added into the summing average. In effect, weighted averaging pretends that there are more good quality responses and less of the noisy ones.
The diagram shown in Figure 5 illustrates this technique.
There are two more points to note.
1. Noise levels
Weighted averaging requires the assessment of the noise level in each individual response. For subjects who have an OAE, each individual response consists of a mix of an OAE signal and noise. Therefore, it is not possible to determine the exact level of noise in any single response.
However, in practice, even quiet noise is always much larger than the OAE in a single response. Therefore, it can be safely assumed that the amplitude of the individual response is only representative of the noise amplitude and so the required scaling factor can be calculated.
2. Scaling
Weighted averaging increases or decreases the size of each individual response before adding it to the average response. This results in an average response that is not correctly scaled. A scaling of the final averaged response is therefore required in order that the final response accurately reflects the true size of the OAE.
Benefits of weighted averaging
There were three distinct observed benefits. Each of these benefits are discussed below.
1. Test time
Averaging across the entire cohort (excluding those where no OAE was obtained by any method), the test time using the weighted method (blue dots) was reduced to 47% of the test time compared to the non-weighted (red dots) method.
However, this average improvement does not reveal the true extents of the benefits. Figure 6 plots the resulting test times for each individual test using the weighted and non-weighted methods.
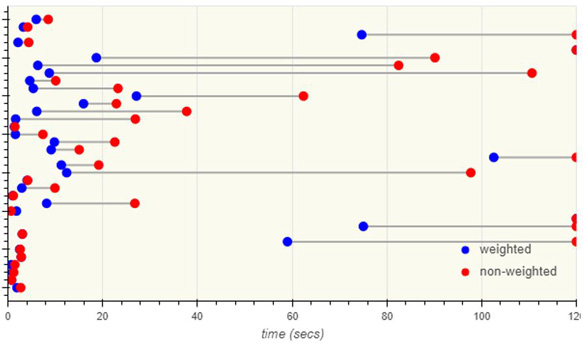
Figure 6 shows that the true benefit of the weighted method is when the test takes longer to get a clear result. This longer time is due to higher noise levels, smaller OAEs, or a combination of both factors.
In the cases of very good OAE levels and low noise, the benefit of weighted averaging was small or insignificant. But once the test time starts to exceed around 7 seconds, the benefit increases significantly.
2. Reject level optimization
Similarly to the study illustrated in Figure 4, we can investigate the effect on the final result as we alter the noise rejection level for any single measurement recording. When weighted averaging is employed, there is only small observable influence on the quality of the final result in response to changing the noise rejection threshold (Figure 7).
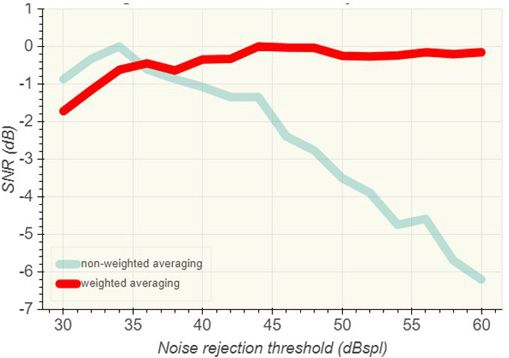
The result for weighted averaging is shown in red and the previous example from the same data using a non-weighted method is shown in light cyan for reference. This result is not unexpected but serves to illustrate the way that high noise epochs during the averaging process are reduced in influence such that they do not negatively impact on the final result.
3. Frequency-specific improvement
The final observed benefit was that when studying the final response to each measurement in the frequency domain, it was observed that the improvement in signal to noise ratio achieved with weighted averaging is not uniform across frequency.
Figure 8 shows the grand average of the signal to noise benefit of weighted averaging across all test subjects who had recordable OAEs.
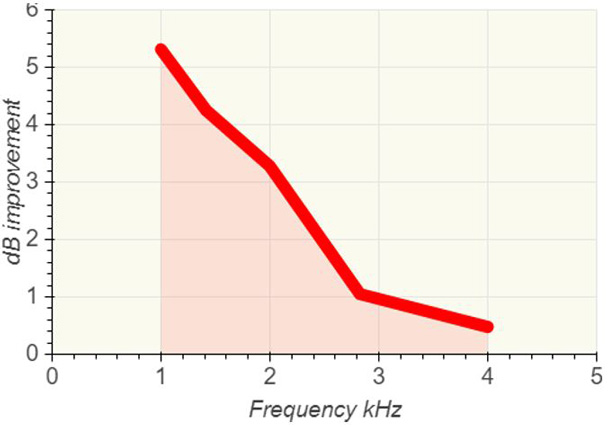
The reason that a frequency-specific benefit is helpful is because environmental- and patient‑generated noise tends to be at frequencies below 2 kHz. This is the reason why it is often more difficult to get OAE measurements at 1 kHz.
Weighted averaging is responding to these low-frequency noises present in the epochs and scaling the data accordingly. Thus, leading to the greatest benefit at these problematic frequencies.
During the evaluation of various weighting scaling methodologies, it was possible to adjust the degree of frequency-dependent benefit. The final chosen algorithm was one which focused its benefits at these more problematic low frequencies to maximize the advantage of weighted averaging in the real clinical test environment.
Conclusions
There are clear benefits to using weighted averaging when the amplitude of the noise varies during the duration of the OAE measurement. These variations in noise amplitude can be over a short period (such as breathing and swallowing noises) or longer periods of noise such as environmental noise or cable-transmitted noise.
There were many instances of measurements that were made in less-than-ideal noise conditions where the test time was reduced to less than 30% of the non-weighted test time.
However, there is no tangible benefit to using weighted averaging versus standard averaging when the:
- Probe cable is perfectly placed
- OAE test is conducted in a sound-treated room
- Test subject is very quiet and has a good-sized OAE
Note though, that there is also no disadvantage to using weighted averaging in these circumstances as the test time and end results will be exactly the same because there will have been no influence from individual response scaling.
Another important benefit of weighted averaging is that the quality and time taken to achieve the OAE result is less dependent on the noise rejection threshold level.
About the author
After obtaining a Medical Physics degree, Dr. Peter Bray worked for five years as a researcher in David Kemp’s team at University College London. This led to a Ph.D. in Biophysics and the design of the ILO88 TEOAE instrument. Dr. Bray spent the following 25 years providing R&D services at Otodynamics designing TEOAE and DPDOE instrumentation. In 2014, Dr. Bray joined Interacoustics as an OAE Specialist and Data Scientist working on the full range of OAE topics besides ASSR screening technology.