
Video Head Impulse Test (vHIT): A Deep Dive
Description
This guide provides clinicians with a complete introduction to video head impulse testing (vHIT).
Table of contents
- What is the head impulse test (HIT)?
- What is the video head impulse test (vHIT)?
- vHIT test procedures
- Pathophysiology of vHIT
- Normal vHIT responses
- vHIT responses in patients with unilateral lesions
- Catch-up saccades in vHIT
- Covert saccades in vHIT
- vHIT test parameters
- vHIT response patterns
- Suppression head impulse paradigm (SHIMP)
- vHIT interpretation
- Clinical applications of vHIT
- vHIT vs caloric test
What is the head impulse test (HIT)?
There are two clinical methods of performing head impulse testing: the bedside head impulse test (HIT), also known as the head thrust test (HTT), and the video head impulse test (vHIT). Both tests measure the function of the vestibulo-ocular reflex (VOR), which is the connection between the vestibular system and the oculomotor muscles.
In the bedside test, equipment is not required. The patient is asked to fixate on a stationary target – usually the tester’s nose. The tester then moves the head rapidly in both right and left directions to stimulate the patient’s right and left lateral semicircular canals. These head movements should be high velocity, low amplitude and unexpected.
In addition to moving the head, the examiner must also monitor the eyes of the patient to look for any unexpected eye movements (more on this later). Lastly, in addition to horizontal eye-head impulses, the head can also be moved in the plane of the anterior and posterior canals which allows for examination of all three semicircular canal pairs.
Normal HIT responses
In normal subjects, the VOR generates compensatory eye movements by moving the eyes in the opposite direction of the head movements by approximately the same velocity. In other words, when the head moves to the right, the eyes move to the left. This gives the impression that the eyes remain stationary in space – always looking at the examiner’s nose.
HIT responses in patients with unilateral lesions
In patients with a unilateral vestibular lesion, the reduced VOR function causes the eyes to fall short of the target (the examiner’s nose) when the head is moved toward the damaged side. Consequently, the patient must make a quick eye movement to bring the eye back to target. This eye movement is called a catch-up saccade.
Overt vs covert saccades
There are two types of catch-up saccade eye movements which can occur. The first is an overt saccade. This is when the saccade occurs after the head comes to a stop. These are visible to the naked eye and detectable in the bedside test. However, there are some patients that learn to initiate the saccades during head movements. These are called covert saccades because they happen so quickly that they are not visible to the naked eye.
Because the bedside HIT cannot detect these catch-up saccades, it will always be limited and is most useful when the patient is in an acute stage of their disease process.
What is the video head impulse test (vHIT)?
The video head impulse test (vHIT) is a quantitative assessment of the VOR. In vHIT, eye movements are recorded and analyzed by high-speed cameras and head movements are measured by motion sensors embedded in the vHIT goggles. To improve testing quality, the device can also monitor the clinician’s ability to deliver appropriate head impulses and provide feedback.
The vHIT addresses some of the shortcomings of the bedside head impulse test. As previously mentioned, the bedside test has a major limitation in its inability to detect covert saccades. The vHIT can measure both covert and overt saccades as well as quantify the VOR gain making it a far superior method for analyzing the VOR.
It has also been validated against the gold standard test of measuring eye movement – the scleral search coil. Although the scleral search coil is the gold standard, it is not performed clinically because it is an invasive method requiring a complicated clinical setup.
vHIT test procedures
Now, let’s discuss the test procedures.
Calibration for vHIT
Before performing the video head impulse test, it is essential to ensure that your equipment is properly calibrated to guarantee that your recordings are valid and reliable. There are two steps to calibrating the EyeSeeCam vHIT system. It is crucial to repeat the calibration processes if there is any significant movement of the patient or a shift in the camera position.
Eye calibration
To accurately calculate the patient's precise gaze during the test, we must first perform a calibration process to record the eye position when looking at targets at known angles relative to the patient.
The goggle includes a built-in laser array that projects a five-dot pattern onto the wall in front of the patient. The patient is instructed to look at each of the dots in turn as directed by the examiner. This process provides a plot of the eye position relative to the five points, which can be reviewed and used throughout the test.
Head calibration
The second stage of calibration adjusts for slight variations in the physical angle or positioning of the inertial measurement unit, which may vary based on goggle positioning and camera adjustments made to obtain a clear view of the patient's eyes.
To perform head calibration, the patient is instructed to keep their eyes on the target on the wall while their head is oscillated—first around the yaw axis (as in shaking your head “no”) and then around the pitch axis (as in nodding your head “yes”). Head movements can be passive, where the clinician moves the patient's head, or active, where the patient moves their own head. The VisualEyes™ software provides feedback on the speed of the movement, which should generally not exceed 100 degrees per second.
To watch the calibration and setup process, please refer to the video below.
Lateral head impulse test
Theoretically, in lateral head impulse testing, the head should be turned downward about 30 degrees to place the lateral canals in the horizontal plane. In practice, it’s better to do the test with the head upright because the differences are minimal. However, in the upright position the eyes are in a better position for recording.
With the goggle on the patient and a calibration performed, the head is then impulsed in the horizontal plane using a similar method to the bedside test. The difference is that the examiner stands behind the patient who is instructed to look at a target which is positioned 1.5 meters away at eye level. The head impulses should be small amplitude (less than 15 degrees) and high velocity (more than 150 degrees per second).
The software will identify if the head impulse matches these criteria by providing a green tick. If the head is not moved at a sufficient velocity, then the impulse will be marked with a red cross. A minimum of seven impulses are required in each direction.
Vertical head impulse test
For vertical head impulses, the test can be performed in the plane of the right anterior, left posterior (RALP) canals or in the plane of the left anterior, right posterior (LARP) canals.
The EyeSeeCam method for recording head impulses starts with the patenting looking straight ahead at the target. The head is then impulsed either downward and 45 degrees to the right (right anterior stimulation) or upward and 45 degrees to the left (left posterior stimulation).
The impulses should be performed in a similar fashion to the horizontal method. However, a slower velocity of 100 degrees per second is acceptable in the vertical planes.
The order which you choose to perform RALP and LARP measurements does not matter and the process for performing both is very similar. The above video demonstrated the technique for RALP measurement. It is important that the impulses are of sufficient speed and come to an abrupt stop, avoiding any significant overshoot.
The video below demonstrates a LARP measurement and focuses in on features within the software which can assist us with performing the measurement by monitoring our technique live.
Pathophysiology of vHIT
When a head impulse is performed in the plane of one of the semicircular canals, it generates excitatory responses toward that canal. The change in the neural firing is a replica of the head velocity. This means you can connect the afferent nerve from this canal directly to the extraocular muscles and get compensatory eye movements without any intervention from the higher levels of the brain.
For head impulses away from the designated canal, an inhibitory response is produced. At rest, the semicircular canals produce a neural firing rate of 90 spikes per second. This means that if the head velocity is high enough during the impulse, it’s likely that the inhibition in neural firing will saturate and clip at zero spikes per second. That means the neural activity is no longer providing an accurate measure of the head velocity.
Normal vHIT responses
In a normal individual, there’s always one of the paired canals in the excitatory mode while the other canal is in the inhibitory mode. VOR eye movements have a very short latency because they’re mediated by the brainstem without higher level brain involvement. In normal individuals undergoing impulses at less than 150 degrees per second, the head and eye movements are about the same and the VOR gain is approximately equal to one.
For high-velocity head impulses, the inhibitory responses saturate quickly but the excitatory responses remain proportional to the head velocity. During this saturation, responses to head impulses are mediated primarily by one of the semicircular canals (the side in which the head was moved towards).
In those without vestibular dysfunction, the asymmetry between excitatory and inhibitory responses and the resulting eye movements remains relatively symmetrical but slightly reduced. In other words, the VOR gain will still be close to 1 but will decrease slightly with increasing head velocity as the saturation effect becomes more prominent.
vHIT responses in patients with unilateral lesions
Let’s discuss impulses toward and away from the side of lesion.
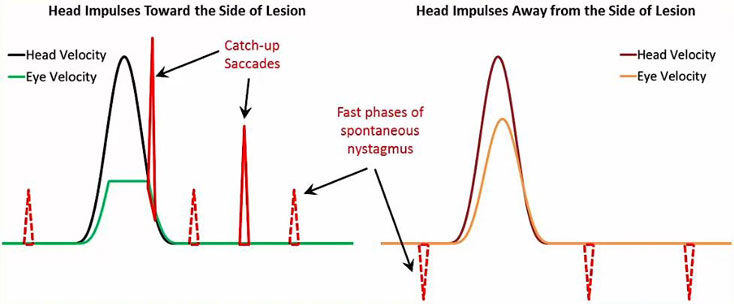
Impulses toward the side of lesion
In a patient with vestibular dysfunction, when the head impulses are toward the side of lesion, the neural responses from the damaged side are reduced or abolished. The neural responses from the intact side are also saturated and no longer proportional to head velocity. That means the resulting eye velocity does not match the head velocity and the eyes fall short of the target. The VOR gain in these patients will be much smaller than 1 and decreases rapidly with increasing head velocity.
Impulses away from the side of lesion
There’s a misconception that the head impulses toward the intact semicircular canal generate normal neural responses. That’s not true. For head impulses away from the side of lesion, the neural response from the intact side is proportional to the head velocity but the neural response from the damaged side is again reduced or abolished.
As a result, the eyes fall somewhat short of the target. The VOR gain is likely to be less than 1 – but usually in the normal range of more than 0.8 – and decrease with increasing head velocity (not as rapidly as impulses toward the side of lesion).
Catch-up saccades in vHIT
In vHIT, we instruct the patients to keep their eyes on the target. If the VOR movements in response to head impulses are not adequate to keep the eyes on the target (the gain is reduced), then the oculomotor pathways will be activated to correctly place the eye in precise location (looking at the target).
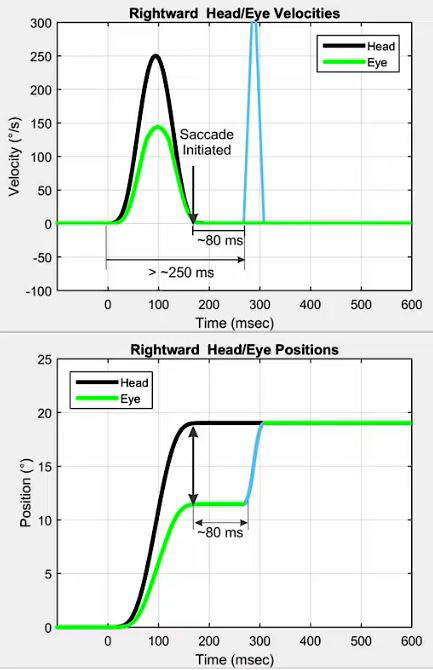
The saccadic mechanism is the main eye movement used to make this correction. With saccadic eye movements, higher levels of brain activity are required, causing a delay and the corrective eye movement. In fact, it takes about 80 to 100 milliseconds for the eyes to begin to move.
In Figure 1 below, we can see what an overt saccade looks like on a vHIT trace. This type of saccade is described as overt because it occurs well after the head movement stops. If we look at the latency from the beginning of the head movement, these saccades have long latencies of about 250 milliseconds or more.
Covert saccades in vHIT
If the patient can predict that the eyes will fall short of the target, they may decide to initiate the saccade before the head comes to a stop. As a result, the saccade may occur during the head movement. This is known as covert saccades which appear on a vHIT trace as in Figure 2. They usually have a latency that is less than 200 milliseconds.
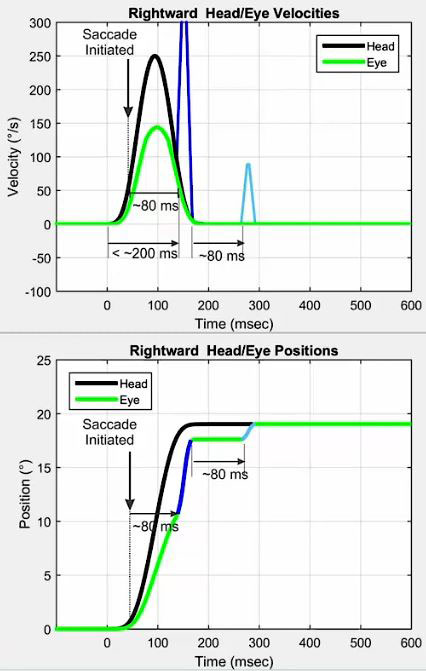
One point that should be made is that these short-latency saccades do not always occur during head movements. They can occur very shortly after the end of the head movement. Covert saccades are usually followed by a small overt saccade because the patient cannot predict exactly where the eyes will end up, especially if head impulses are performed unexpectedly. Often, these overt saccades are too small to be detectable without recording technology.
The mechanism for triggering covert saccades is not fully understood but it is thought to involve some form of predictive or learning behavior. The preliminary reports suggest that covert saccades are associated with compensation. That is, patients with covert saccades demonstrate:
- Improved balance
- Reduced symptoms
- Better dynamic visual acuity
But these are preliminary results and require more studies.
vHIT test parameters
Now that we understand what can happen during a vHIT, let’s discuss how vHIT parameters are measured or calculated so we can understand the vHIT report.
1. Optimal head velocity range
As we discussed, both visual and vestibular mechanisms can contribute to head impulse testing. Before we discuss how vHIT parameters are measured, we have to make sure that the responses are coming from the vestibular system only. For that, the head velocities must exceed the threshold.
That threshold is about 100 degrees per second for lateral head impulses. For the maximum limit, we try to stay below 250 to 300 degrees per second for safety reasons. Fortunately, most vHIT systems these days allow you to set the limits beforehand and impulses that are not within the prescribed range will not be accepted.
For vertical vHIT, the minimum can be reduced to about 50 degrees per second and the maximum down to about 200 degrees per second. That’s because the vertical smooth pursuit system is not as effective, and its velocity limits are lower than the horizontal smooth pursuit.
2. Number of impulses
Along with the peak impulse velocity, another question about best practices in performing vHIT is: How many impulses are needed for interpretation?
Earlier recommendations were for performing at least 20 impulses for each direction. That approach is no longer recommended. It turns out that quality is more important than quantity. The current thinking is that you need no more than three to five good impulses for interpretation.
Of course, you may need to do more than that so that after removing noisy and artifactual tracings, you can still end up with that minimum of three to five. Keeping an eye on the screen as you do the test can help you decide if you’re getting enough good, clean impulses.
3. VOR gain
The VOR gain quantifies the relationship between VOR (slow) eye movements and head movements. It’s calculated as the ratio of VOR eye movements over the head movements, but there’s disagreement about what measures of head and eye movements should be used to calculate the VOR gain. Some systems use instantaneous velocity, others use position, and some use the regression between the head and eye velocities.
The results may be different depending on which method is used. Let’s also remember that the interpretation of the VOR gain in vHIT is complicated. Although VOR gains are represented in an audiogram‑like form, they do not reflect the function of a single canal. They always represent the function of both involved canals.
Method 1: Velocity
For the instantaneous velocity method, the VOR gain is typically calculated at a fixed interval (40, 60, or 80 milliseconds) after the onset of the head impulse. Depending on the eye velocity shape, values at different intervals may be different.
The advantage of this method is that the eye velocities are usually not contaminated by potential covert saccades. The disadvantage is that the instantaneous velocity gain is more susceptible to certain artifacts such as goggle slippage.
Method 2: Position
The VOR gain can also be calculated by taking the area under the head and eye velocity curves. This gives us the final head and VOR eye positions after the head impulse. For this method, covert saccades must be removed before calculating the area under the curve.
The advantage of the position gain is that it is directly related to what causes the catch-up saccades, which is the difference between eye and head positions. Another advantage is that it’s less sensitive to some types of goggle movements.
The disadvantage is that one has to first remove the covert saccades. Otherwise, they will affect the gain calculation. Another disadvantage is that it’s more sensitive to pupil detection artifacts.
Method 3: Regression
In the regression method, the eye and head velocities for the first 100 milliseconds of the impulse are considered and the VOR gain is calculated based on the slope of the best-fitting line that goes through these points. The advantages and disadvantages of the regression method are similar to the velocity method, with the added benefit that the regression gain is more robust and less sensitive to goggle movements.
4. Catch-up saccades
Abnormal catch-up saccades are the most important sign of a lesion involving the ipsilateral semicircular canal or its afferent neural pathway. Unfortunately, the criteria for abnormal catch-up saccades are still emerging.
To interpret catch-up saccades, consider the following items:
- Frequency
- Direction
- Latency
- Velocity
Frequency
First, how many of the impulses produce significant catch-up saccades and at what head velocities?
Direction
Second, are the catch-up saccades in the same or opposite direction as the VOR eye movements?
Latency
Third, are they short-latency or long-latency saccades and what is the intersaccadic latency?
When considering the latency, concentrate on the latency of the first saccade for each head impulse. The value for short-latency saccades is usually less than 225 milliseconds and higher than that for long‑latency saccades.
Some systems give you the values and allow you to edit the profiles if something is not right. The measured latencies depend on the saccade algorithm and norms may be specific to each system.
Velocity
Currently, most devices characterize saccades using the peak-saccade velocity. But this may not be the best measure because the peak-saccade velocity is related to the amplitude and duration of saccades, especially when there's more than one saccade during each impulse. For example, if the duration is large, then the peak velocity may be lower.
In addition, both the peak velocity and latency are affected by filtering that’s necessary to condition the eye velocities. So, it’s conceivable that a different parameter – namely cumulative saccade amplitude – may be a more stable parameter for characterizing the catch-up saccades. But it’s not being used currently.
vHIT response patterns
With the knowledge of vHIT pathophysiology and parameters, let’ s examine which patterns of vHIT results can be considered valid.
1. Normal
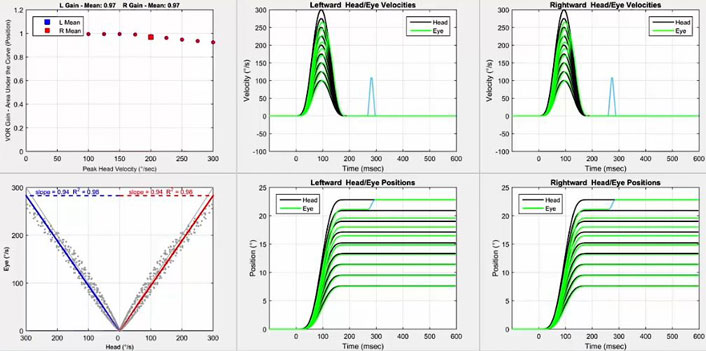
The first pattern is the normal vHIT pattern which is represented by the absence of significant catch-up saccades and VOR gains that are greater than 0.8 bilaterally (Figure 3). A few small catch-up saccades may occur, especially for high-velocity head impulses. Let’s remember that normal vHIT does not mean normal vestibular function. In fact, the caloric test and VEMPs may show patterns consistent with peripheral vestibular abnormalities in the presence of normal vHIT results.
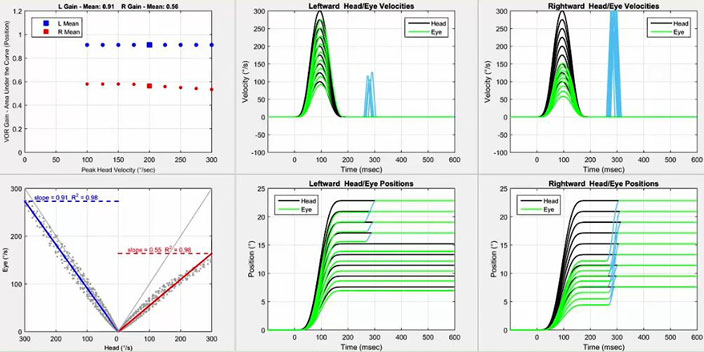
2. Unilateral loss
The next pattern is unilateral loss (Figure 4). It’s represented by the presence of significant catch-up saccades on one side along with asymmetric gain (usually less than 0.8 for side of lesion). This pattern indicates a unilateral lesion involving the ipsilateral semicircular canal or its branch of the vestibular nerve. Catch-up saccades may also be present for impulses away from the side of lesion, but they are not as large, and they usually start at higher head velocities.
Initially, most of the catch-up saccades have a long latency, which are referred to as overt saccades. Over time – with learning and prediction – short-latency (covert) saccades may develop. Covert saccades are usually followed by a small overt saccade. As we talked about it before, covert saccades have been associated with compensation in preliminary reports.
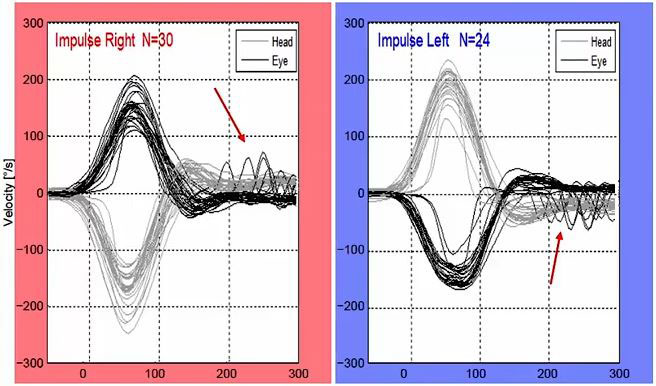
3. Spontaneous nystagmus
When there’s spontaneous nystagmus or gaze nystagmus, the interpretation of vHIT becomes complicated. That’s because fast phases of this nystagmus appear as spikes in eye velocity tracings and can be mistaken for catch-up saccades. But there are crucial differences.
Unlike catch-up saccades, spikes for spontaneous nystagmus can occur before or after head impulses. Also, the velocity of spontaneous nystagmus fast phases is usually much smaller than the velocity of catch-up saccades. In acute lesions, fast phases of spontaneous nystagmus will be intermixed with catch-up saccades for impulses toward the side of lesion. But they will be in the opposite direction of typical catch-up saccades for impulses away from the side of lesion as seen in Figure 5 below.
4. Acute unilateral lesion
Another valid pattern is for a patient with an acute unilateral lesion (Figure 6). In this case, you have the characteristics of a unilateral loss as discussed earlier but the patients will also have spontaneous nystagmus and these fast phases of spontaneous nystagmus will be intermixed with catch-up saccades.
You can distinguish the two based on the differences that we discussed above. For example, the spikes for spontaneous nystagmus can occur before or after head impulses. And more importantly, fast phases of spontaneous nystagmus will be in the opposite direction of catch-up saccades for impulses away from the side of lesion.
5. Bilateral loss
Finally, bilateral loss is characterized by significant catch-up saccades on both sides along with reduced gain on both sides (usually less than 0.8) (Figure 7). In case of symmetrical loss, gain asymmetry is expected to be minimal. But for bilateral losses that are unequal, the VOR gain pattern can be similar to the gain pattern for unilateral vestibular deficits. As we’ll see later, if the sum of the right and left VOR gains is less than one, there has to be a loss on both sides.
Suppression head impulse paradigm (SHIMP)
When considering the bilateral loss pattern, a supplemental test called SHIMP, which stands for suppression head impulse paradigm, may be a helpful addition to the standard vHIT.
In SHIMP, a laser which is attached to the goggle becomes the target (instead of a static target on the wall). This target moves when the head is moved instead of being stationary. In normal individuals, when the head impulse is performed to one side, the VOR generates compensatory eye movements and keeps the eyes straight ahead. But now, the target has moved ahead of gaze and the subject must make a saccade to get to the target.
The direction of the saccade is in the opposite direction of typical catch-up saccades. These types of saccades are sometimes called anti-saccades or wrong-way saccades. In patients with bilateral loss of function, the eyes move with the head because there’s no VOR and end up on the target. As a result, no catch-up saccades are needed.
In bilateral-loss patients, SHIMP makes it easier to measure the VOR gain because the responses are not contaminated with catch-up saccades (Figure 8). But in reality, the usefulness of SHIMP is limited to these patients and it’s not particularly helpful in other cases.
vHIT interpretation
When interpreting the test, first consider the artifacts and determine if the test is interpretable. Too many artifacts and certain types of artifacts may make the test uninterpretable. When trying to identify the artifacts, the important part of this involves separating real, fast eye movements from artifactual eye movements.
Real, fast eye movements can be:
- Long-latency catch-up saccades
- Short-latency catch-up saccades
- Fast phases of spontaneous nystagmus
Then there’s everything else. When trying to identify saccade types and whether they’re real or artifactual, look at the individual impulse tracings. It’s hard to determine anything from looking at the results of all impulses in the same graph.
Artifacts and saccade lookalikes
Below, we present types of artifacts and saccade lookalikes.
1. Two consecutive saccades in opposite directions
When you have two consecutive saccades that are going in opposite directions at about 80 to 100 milliseconds apart, this means that the patient is looking around and not keeping the eye on target. If this is frequent, reinstruct the patient.
2. Biphasic or uniphasic artifacts
Biphasic or uniphasic artifacts are caused by:
- Eye blinks
- Eyelids obstructing the pupil
- LED light intruding on the pupil
Compare these with the actual saccades. These apparent movements are too fast, and their durations are too small to be actual eye movements. These artifacts are more common when the pupil is large.
To improve the situation, you can shine a light – preferably on the eye that's not being recorded – to shrink the pupil. When performing impulses, pay attention to the display. If you are getting too many artifacts, stop and figure out why. When analyzing the data with artifacts, delete the affected impulses before interpreting the test. Recording the video of eye movements can also be helpful in identifying these types of artifacts.
3. High-frequency oscillations
Another type of artifact that's caused by pupil detection issues is high-frequency oscillation of the eye velocity tracings. Again, these are too fast to be real eye movements. You can adjust the cameras, the focus, and the threshold of pupil detection to get improved results. If you have too many tracings that contain high-frequency oscillations, then the test may become uninterpretable.
4. High or low gain with absent catch-up saccades
If the VOR gain is much higher or lower than 1, but there are no catch-up saccades, this usually represents some form of artifact – most likely bad calibrations. If the eye velocity tracing is leading the head velocity tracing, that usually indicates some form of goggle slippage. Bumping the goggles can also affect the eye velocity and head velocity tracings.
Once you have taken care of the artifacts, you can proceed with the interpretation. Next, find out if there are abnormal catch-up saccades. Use the guidelines for consistency, direction, timing, and amplitude to determine if they are significant.
If there are no significant catch-up saccades, check the VOR gains to see if they are within normal limits – usually close to 1 and higher than 0.8. If the VOR gains are not within normal limits in the absence of abnormal catch-up saccades, you should consider the presence of some sort of an artifact.
Normal results
In Figure 9, there is an example with no clearly-identifiable catch-up saccades. VOR gains are close to 1 bilaterally, head velocities are approximately equal for right-left impulses, and they are within the optimal range. There are no other signs of artifacts and this vHIT should be considered normal.
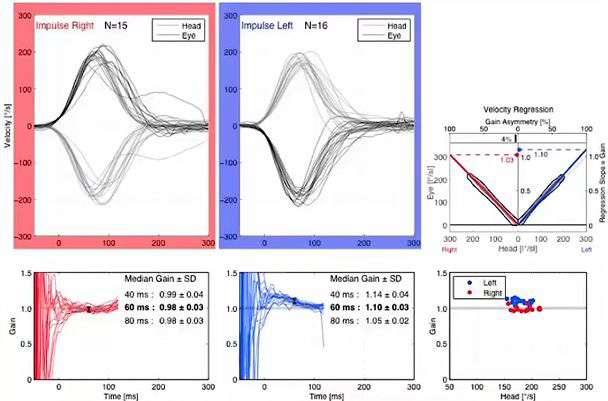
In Figure 10, there are a few catch-up saccades bilaterally, especially for high-velocity head impulses. The saccade velocities are much smaller compared to the head velocities, so this most likely represents a normal vHIT. If the saccade amplitudes were higher, one may have considered calling these abnormal – even if the VOR gains were not below 0.8 – as the result may have shown a mild bilateral lesion.
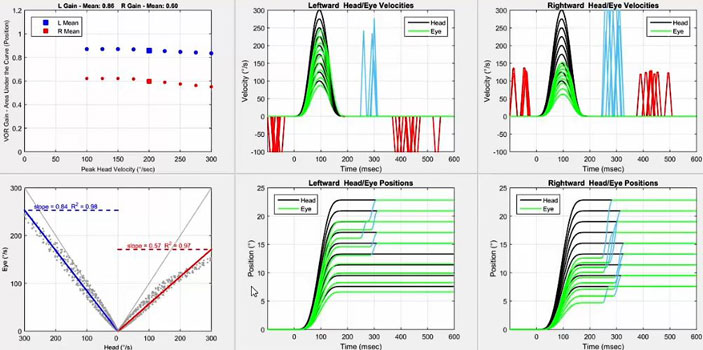
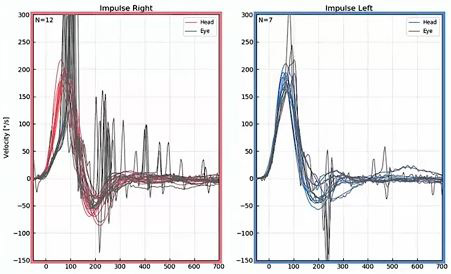
Unilateral vestibular deficit
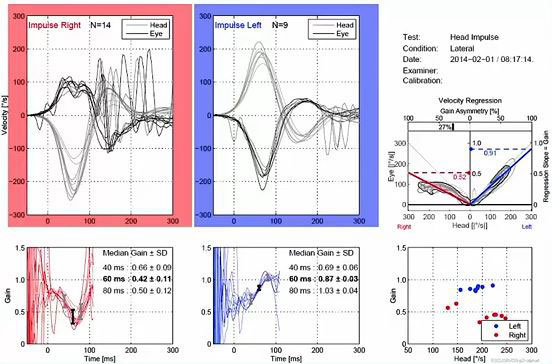
In Figure 11, there are catch-up saccades for rightward head impulses and the VOR gain is asymmetric with significantly‑lower‑than‑normal VOR gain for rightward head impulses. This indicates a unilateral vestibular deficit on the right. The VOR gains for leftward head impulses are also reduced, although they are within normal range here. But it would not have made a difference. Even if the gain was not within normal range, it would not have changed the interpretation.
If we look at the LARP and RALP responses of that same patient (Figure 12), you can see that this patient has abnormal findings for the right posterior canal and to a lesser extent for the anterior canal on the same side. That means this is a global, right-sided lesion affecting all three semicircular canals.
If abnormal catch-up saccades are present in both directions, determine the shape of the VOR eye velocities for each direction.
If your eye velocities are clipped or saturated for one direction but proportional to head velocities in the opposite direction, consider vHIT consistent with a unilateral lesion on the side of the clipped or saturated eye velocity responses.
This type of finding is usually accompanied by a significant gain asymmetry with the lower gain for the side of lesion. The interpretation is the same and it doesn't matter if the VOR gain for the contralateral side is within normal limits or not. It's important to recognize that in cases like these, we cannot completely rule out the presence of bilateral, asymmetric loss of function.
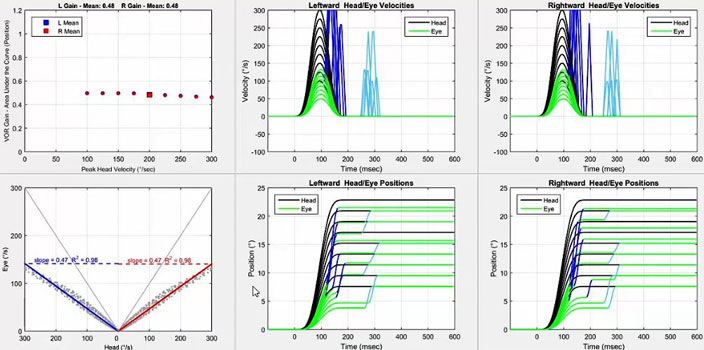
If the VOR eye velocities exhibit clipping or saturation in both directions, then one can be more confident that the vHIT is consistent with bilateral loss of function in both involved canals or their afferent neural pathways. This finding is usually accompanied by bilateral reduction of gain.
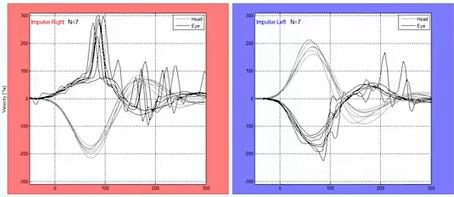
In Figure 13, we have abnormal catch-up saccades in both directions but more significant for rightward head impulses. We also have clipped VOR eye velocities for rightward head impulses and proportional VOR velocities for leftward head impulses. So this is likely a right unilateral vestibular deficit as opposed to an asymmetric, bilateral one. The VOR again for leftward head impulses may be abnormal but the interpretation is the same.
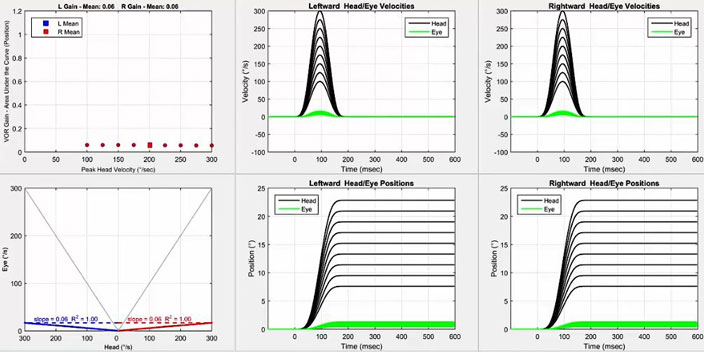
Bilateral vestibular deficit
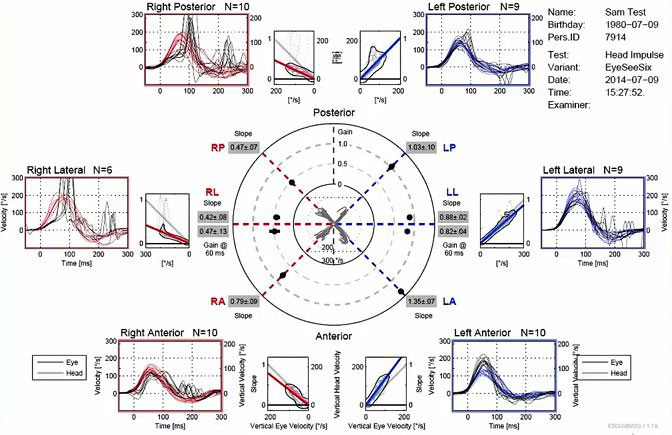
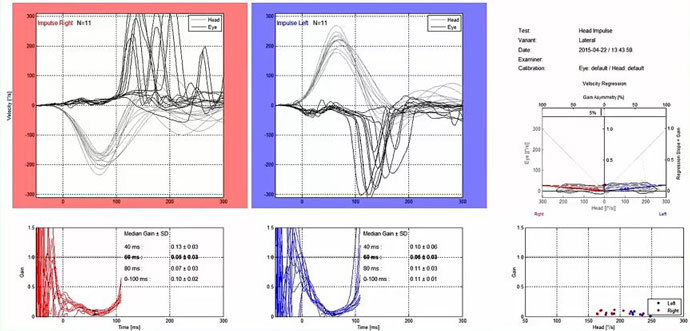
In Figure 14, there's an example of a complete bilateral loss. Abnormal catch-up saccades are present bilaterally and the VOR gain is close to zero for both directions. If you remember, we could use SHIMP in this patient for better calculation of the gains. But in this case, it doesn't really seem to add much because the catch-up saccades occur fairly late during the head movement.
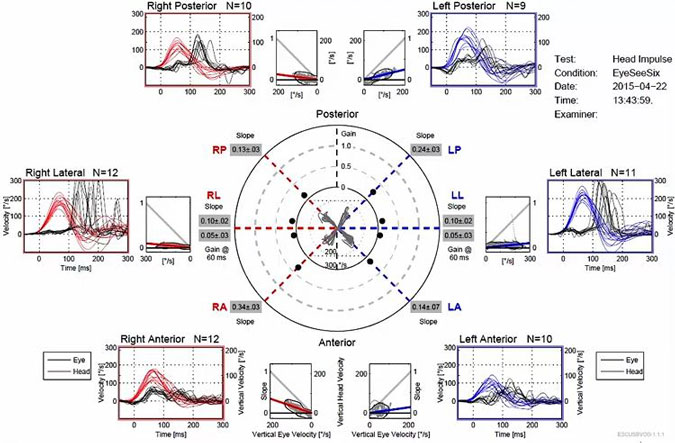
If you look at the complete test results (Figure 15), the results for this same patient show bilateral loss more or less across the board. This makes sense, as this is a patient who was exposed to vestibular toxic medications.
Next, if saccades are present but they are in the opposite direction of the VOR eye movements in at least one direction, then consider the presence of spontaneous nystagmus. The most likely presentation of this type of finding is in a patient with an acute peripheral vestibular lesion.
Spontaneous nystagmus
Fast phases of spontaneous nystagmus appear as spikes in the eye velocity tracings. Spontaneous nystagmus fast phases can occur before or after head impulses. For typical spontaneous nystagmus that beats away from the side of lesion, spikes appear in the opposite direction of VOR eye movements following head impulses toward the intact site. Fast phases of spontaneous nystagmus are intermixed with the catch-up saccades during head impulses toward the side of lesion (Figure 16).
Sometimes, displaying a longer time frame and overlapping the eye and head velocities can help with identifying fast phases of spontaneous nystagmus (Figure 17).
Interpretation of catch-up saccades
How do we go about interpreting catch-up saccades?
1. Identify artifacts
First, identify impulses that have artifacts and delete them.
2. Account for spontaneous nystagmus
Account for spontaneous nystagmus by identifying wrong-way saccades for impulses toward the intact site.
3. Identify true catch-up saccades
Identify true catch-up saccades using the latency of the first saccade.
4. Determine significant saccades
Determine significant saccades using the saccade peak velocities.
We don't have good norms, but one suggestion is to use peak saccade velocities greater than 100 degrees per second as the threshold for abnormal catch-up saccades. Another suggestion is to use peak velocities that are greater than half of the peak head velocity.
Regardless of which method you use, determine how many of the impulses have significant and abnormal saccades.
5. Determine frequency of significant catch-up saccades
We may have catch-up saccades for both rightward and leftward impulses, but they are more frequent to the side of lesion, and they usually start at lower head velocities. If most of the head impulses produce catch-up saccades that are significant, consider the test abnormal – even if the VOR gain is not in the abnormal range.
In some cases, you may have normal VOR gain, but small and consistent catch-up saccades either on one side or both sides. Anecdotally, this might indicate a mild lesion. But this is not definitive and needs more research.
Summary of vHIT interpretation
In the presence of abnormal catch-up saccades that meet the consistency, direction, timing, and velocity criteria, vHIT should be considered abnormal regardless of whether the VOR gain is normal or abnormal. Conversely, abnormal VOR gains in the absence of catch-up saccades should be investigated further for possible artifacts.
Again, let's emphasize that the VOR gain is a complicated parameter which depends on the method of calculation and the underlying test conditions. Finally, head velocities must be within a specific range and right-left velocity profiles must be approximately the same for valid interpretation of vHIT.
Clinical applications of vHIT
The bottom line is that the vHIT is a cost-effective method and it reduces the need for other tests. Let's go through a few reasons why.
1. Identify isolated abnormalities in vertical canals
One of the most important contributions of vHIT is the ability to identify isolated abnormalities in the vertical canals and their neural pathways. It can determine which branch of the vestibular nerve is involved and it is also a fast way to determine when and if function returns to the vestibular nerve.
2. Serial testing
The test can be used for serial testing. For example, monitoring:
- Gentamycin therapy for Meniere’s disease
- Patients who are receiving certain types of antibiotics
- Vestibulotoxicity in patients who are receiving chemotherapy
3. In patients with bilateral caloric weakness
The vHIT can be used in place of rotation testing in patients with bilateral caloric weakness. It is not as good as the rotation chair for this purpose, but it's much cheaper and faster.
4. Modify for testing in children
Similarly, vHIT can also be modified for testing children. For example, before cochlear implantations.
5. Differentiating peripheral vestibular disorders from stroke in acute persistent vertigo
Another application of vHIT is in differentiating between vestibular disorders and stroke in acute vertigo, especially in the emergency room settings [3].
This follows the acronym HINTS, where HI stands for Head Impulse. If the head impulse results are abnormal, it usually means a peripheral vestibular disorder. If the results are normal, it adds about 60% to the chance that the cause is a stroke.
N stands for Nystagmus. When it's unidirectional, it's consistent with peripheral vestibular disorders. But if it changes direction in different gaze positions, the likelihood of a stroke increases by another 30% or so.
TS stands for Test of Skew. If we see a vertical shift in the gaze direction when covering and uncovering the eye, that implies skew deviation. Skew deviation adds another 9 to 10 percent to the chance of stroke.
Overall, HINTS has a 99% sensitivity and 97% specificity for differentiating peripheral vestibular disorders from stroke in acute vertigo. Compare that with MRI, where the sensitivity in the first 48 hours after a stroke is around 95%. That's because 10 to 15% of patients with posterior circulation stroke will have a normal MRI within the first 48 hours. CT scans have a much lower sensitivity.
vHIT vs caloric test
Any time we have a new test of vestibular function, there's always an attempt to compare it with the caloric test, which is considered as the gold standard.
1. Comparing frequency ranges
Let's remember that these different tests of vestibular function cover different frequency ranges of the vestibular system. The caloric test covers the very low‑frequency range and vHIT covers the high‑frequency range.
If one was doing a hearing test, we wouldn’t expect the results at low and high frequencies to be identical. We shouldn't expect that here either. We should consider the test results complementary, just like as we do in the hearing test.
One additional point here is that the abnormalities in the auditory system typically start at high frequencies and extend to lower frequencies as the damage becomes more severe. For vestibular abnormalities, the effect usually starts at low frequencies and extends to high frequencies for more severe abnormalities. That's why it's possible to have normal vHIT but abnormal caloric findings.
2. Estimating loss of canal function
Based on the above, we should not try to compare the caloric weakness with the VOR gains in vHIT, but this is done routinely in the literature. So even though it's not a real good idea, let's see if there's a correspondence between the two.
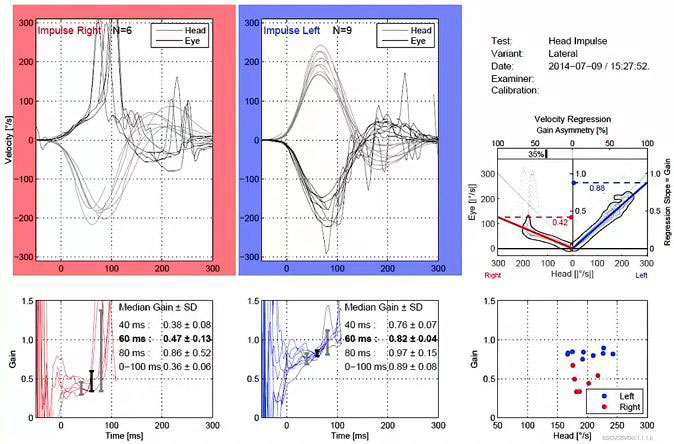
In 2019, [4] that showed how one can determine the total vestibular function in vHIT. That can be accomplished by finding the total of right-left VOR gains in %.
If we look at Figure 18, the right VOR gain is .42 and the left VOR gain is 0.87. So, the sum of these two will give you 1.29 or 129%, which tells us how much total function is remaining in this patient. If we subtract this from 200%, that will give us the total loss of function. In this case, 71%.
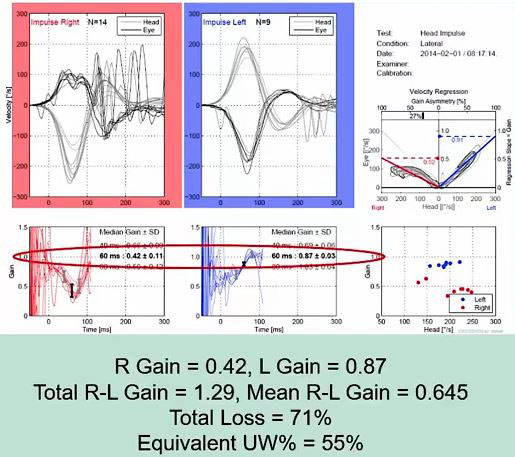
This loss can all be in one ear, or it could be a combination of loss from different sides. For the caloric test, we always assume the loss is unilateral. If that's the case, then if one divides the total loss by the total function, you will get the equivalent unilateral weakness in the caloric test.
In this case, that will be 0.71 divided by 1.29, which yields an equivalent unilateral weakness of 55%. In this patient – if the loss in both caloric frequencies and the vHIT were similar – we would expect a caloric weakness of 55% and on the right side.
This calculation also supports what we said earlier: If the total right-left VOR gains are less than one, then one must have loss in both ears. Not necessarily symmetrical, but some form of loss in both ears.
Summary of vHIT vs caloric test
To summarize the general rule is that if vHIT is clearly abnormal, it's very unlikely that the caloric test will be normal. So, if the lateral vHIT is abnormal, you can skip the caloric test or at least do a reduced test like the monothermal caloric test.
There have been reports of patients with normal lateral vHIT, but abnormal caloric results. In fact, some studies have suggested that vHIT results are often normal if the unilateral caloric weakness is less than 40%. I previously pointed out that one has to compare the total VOR gain with the unilateral caloric weakness and not just the VOR gain for the side of lesion.
Based on the previous calculations, we can determine that for a unilateral caloric weakness of about 25% – which is considered the normal limit – the sum of the right‑left VOR gains will be approximately 1.6, averaging at 0.8 for each side. This is the lower normal limit for the vHIT.
There are also studies of patients with Meniere’s disease who have normal vHIT, but abnormal caloric results. This has been attributed to either the difference in the operational frequency range or due to the whirlpool effect of the caloric irrigation in these patients. But it's also worth mentioning that more recent studies show that if one incorporates catch-up saccades in the interpretation – not only relying on the VOR gains – the incidence of vHIT abnormalities in Meniere’s patients go up [5].
It is clear that vHIT should not be considered as a replacement for the caloric test. The results from the two tests should be considered as complementary, covering different frequency ranges of the vestibular system. By performing vHIT first, one can complete the caloric test with fewer irrigations and avoid unnecessary reputation of irrigations when results are questionable.
Related course: vHIT vs caloric test: Which one to use and when do I need both?
Summary
In summary, vHIT is an excellent ‘first’ test that that can be done quickly. When it's clearly abnormal, vHIT will reduce the need for tests such as the caloric test that take much longer and can be unpleasant. We can uniquely detect abnormalities in the vertical canals, unlike any other test.
Normal results do not necessarily rule out vestibular abnormalities. The vHIT is subject to some artifacts that can complicate the interpretation of the results, so if you are getting very interesting or unexpected results, view them with skepticism until you can fully explain those results based on pathophysiology.
A final important point is that artifacts do not seem to affect the presence or absence of catch-up saccades, which should be the focus of interpretation instead of the VOR gain.
References
[1] Migliaccio AA, Cremer PD. The 2D modified head impulse test: a 2D technique for measuring function in all six semi-circular canals. J Vestib Res. 2011;21(4):227-34. doi: 10.3233/VES-2011-0421. PMID: 21846955.
[2] Patterson J, Rodriguez A, Barin K, Janky KL. Effect of Gaze Angle During the Vertical Video Head Impulse Test Across Two Devices in Healthy Adults and Subjects With Vestibular Loss. Otol Neurotol. 2020 Jul;41(6):e751-e758. doi: 10.1097/MAO.0000000000002652. PMID: 32343516; PMCID: PMC7311278.
[3] Newman-Toker DE, Kerber KA, Hsieh YH, Pula JH, Omron R, Saber Tehrani AS, Mantokoudis G, Hanley DF, Zee DS, Kattah JC. HINTS outperforms ABCD2 to screen for stroke in acute continuous vertigo and dizziness. Acad Emerg Med. 2013 Oct;20(10):986-96. doi: 10.1111/acem.12223. PMID: 24127701.
[4] Barin K. Estimating loss of canal function in the video head impulse test (vHIT). J Vestib Res. 2019;29(6):295-307. doi: 10.3233/VES-190688. PMID: 31868701; PMCID: PMC9249275.
[5] Bharadwaj S, Petrak MR, Bahner CM, Sharp LE, Mosey-Claycomb SF, Matsuoka AJ. Diagnostic value of refixation saccades in the Video Head Impulse Test (vHIT) in unilateral definite Meniere’s disease. Acta Oto-Laryngologica 2020, 140(7):537-543. doi: 10.1080/00016489.2020.1744720.
Presenter
